No deploy without a monitor.

Your pipeline or its coding agent (Claude Code, Codex, ChatGPT) registers the monitor over MCP. By default, two regions confirm an outage before anyone is paged, and every incident goes into your availability record with its duration.

Try Sentinel free for 90 days, no credit card. Every price is public. Datargo GmbH in Germany operates Perstat on an EU control plane.

Perstat’s own statusstatus page
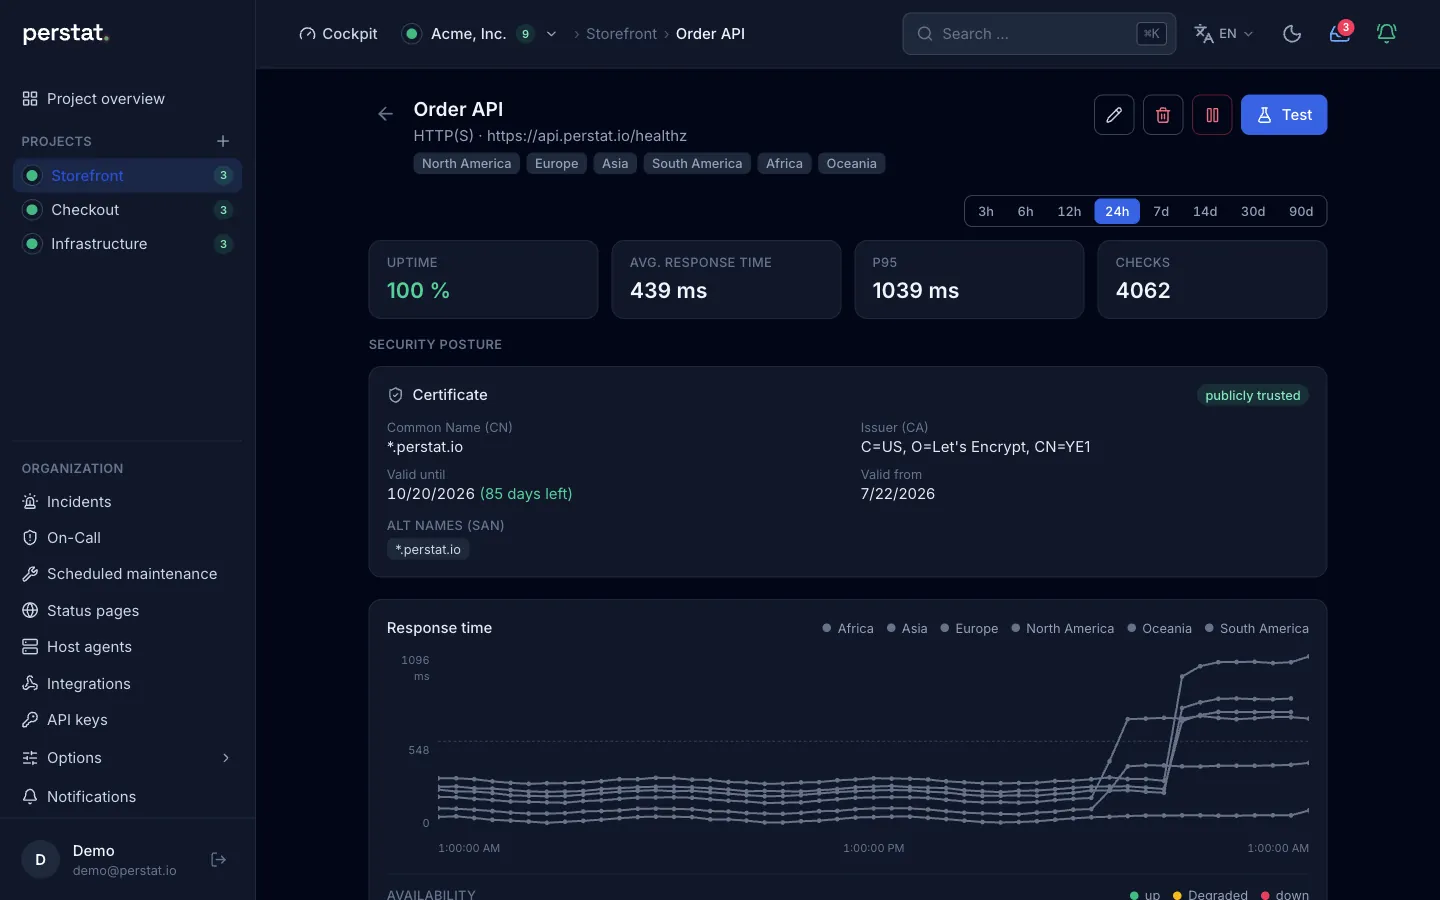
Perstat monitor view of Order API with its check regions, uptime, response times, and certificate details
deploy · order-api 2.16.0Example
  1. build
  2. deploy
  3. register monitor

Order API created, checked from 6 regions

The monitor view at app.perstat.io. Real product UI, sample data. The deploy card is an example.

Releases outpace monitors created by hand

Services, endpoints, and jobs go live every week. Follow one deploy through Perstat, from the pipeline to the availability record.

Skip the story
Skip the story
  1. Every release adds something to watch

    order-api 2.16.0 adds a payments webhook. Of the last 8 deploys, 3 shipped an endpoint, a job, or a service without a monitor, because creating one was a separate task.

    Deploy logExample
    1. 09-10 14:02order-api 2.16.0+ /webhooks/paymentsno monitor
    2. 09-10 11:47search-indexer 1.9.3worker poolmonitored
    3. 09-09 17:20checkout-web 4.2.0+ /api/cart/v2no monitor
    4. 09-09 09:15auth-service 3.1.1token rotationmonitored
    5. 09-08 16:40image-resizer 0.7.0new serviceno monitor
    6. 09-08 10:05mail-relay 1.4.2patchmonitored
    7. 09-05 15:30order-api 2.15.4patchmonitored
    8. 09-05 08:12status-sync 0.3.0cron jobmonitored

    3 of 8 deploys added something without a monitor

  2. Put the monitor into the deploy

    One step after the release job is enough. It calls the MCP endpoint with an organization API key. It fails the job on any error, unless the monitor already exists.

    deploy.ymlExample
    # after the release job: register the monitor- name: Register monitor  run: |    result=$(curl -sS --fail-with-body https://api.perstat.io/mcp \      -H "Authorization: Bearer $PERSTAT_API_KEY" \      -H "Content-Type: application/json" \      -d '{"jsonrpc":"2.0","id":1,"method":"tools/call","params":{        "name":"create_monitor","arguments":{"project_id":"prj_…",        "name":"Order API","type":"http",        "config":{"url":"https://orders.example.com/health"}}}}')    echo "$result" | jq -e '.result.isError == false      or (.result.content[0].text        | contains("already runs exactly this check"))'
  3. One monitor, however often you deploy

    The result returns the new monitor. The next run is refused as an exact repeat, and the step still passes. If the health path changes, update_monitor edits the existing monitor instead of adding a second one.

    mcp › create_monitor, called by your pipeline or your coding agentExample
    {  "created": true,  "monitor": {    "id": "mon_…",    "archived": false,    "name": "Order API",    "type": "http",    "project_id": "prj_…",    "enabled": true,    "interval_seconds": 300,    "regions": ["na", "eu", "as", "sa", "af", "oce"],    "status": "unknown",    "severity": null  }}
    Next deploy

    `Order API` (mon_…) already runs exactly this check in this project: same type, identical config, every 300 s from 6 region(s).

  4. Six regions start checking

    Probe nodes on 6 continents run the check at its interval. Perstat stores every result with the region that measured it.
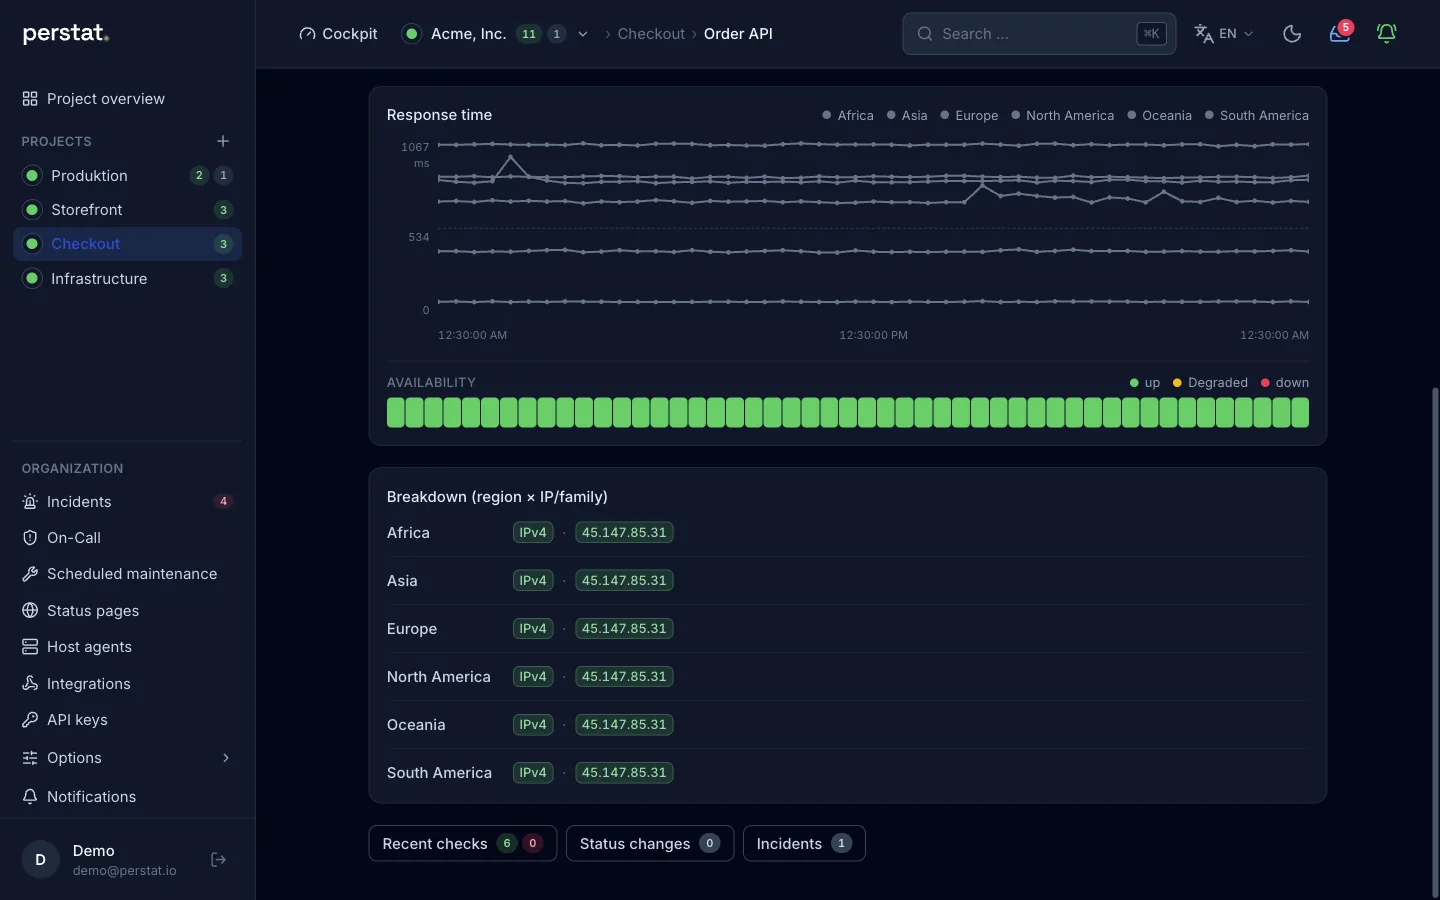
    Perstat monitor view with response times per region and a breakdown of results by region
    • naNorth America
    • saSouth America
    • euEurope
    • afAfrica
    • asAsia
    • oceOceania
  5. Two regions confirm the outage

    A failure in one region is a quiet notice, not a page. When a second region reports a failure too, the default quorum confirms the outage and opens exactly one incident.

    Quorum for Order APIExample
    • naewrNewarkFailed
    • sagruSão PauloOK
    • eufraFrankfurtOK
    • afjnbJohannesburgOK
    • assgpSingaporeFailed
    • ocesydSydneyOK

    na (Newark) reports a failure: a quiet notice, nobody is paged yet.

    as (Singapore) reports a failure too: quorum reached, incident opened at 02:41:12 UTC.

  6. Alerts escalate until someone acknowledges

    Perstat alerts iPhone and Apple Watch, and Slack, Teams, or PagerDuty through connectors. On-call escalation moves on to SMS and a phone call until someone acknowledges.

    On-call escalation: Sentinel and above
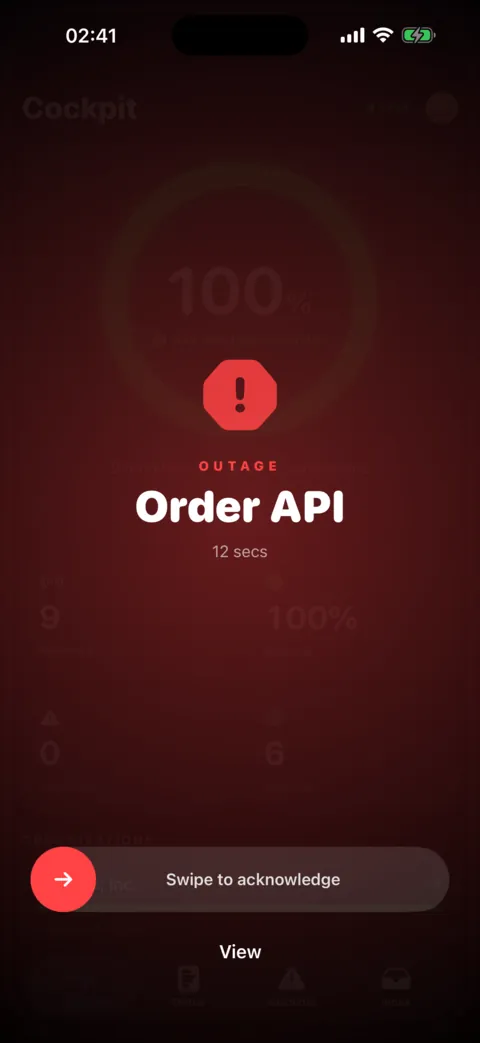
    Full-screen Perstat outage alert for Order API on iPhone with a swipe control to acknowledge
    On-call escalation until someone acknowledges
    1. PushNative notification on iPhone and Apple Watch.
    2. SMSA timed stage of on-call escalation.
    3. Phone callThe last stage of on-call escalation, on any phone.
    4. AcknowledgedOwnership is visible, and the remaining devices go quiet.
    Also through connectors
    • Slack
    • Microsoft Teams
    • Discord
    • Google Chat
    • PagerDuty
    • Opsgenie
    • Webhook

    Personal SMS alerts without a rotation: Pulse and above

    acknowledge_incidentOr from the terminal: your agent calls acknowledge_incident over MCP, attributed to the owner of the key.

  7. Customers see it on the status page

    The incident opened by the quorum appears on the linked status page with its current phase, and the component switches to Down. Nobody has to copy it over by hand.

    status.example.comExample

    Major outage

    • Order APIDown
    • StorefrontOperational
    • SearchOperational
    AcknowledgedOrder API02:41:12 UTC
  8. The incident goes into the availability record

    When the regions report recovery, the incident closes with its confirmed start, end, and duration. Announced maintenance is excluded for its window. Perstat calculates availability from the same record.

    Availability recordExample
    Order APIQ2 2026
    1. 2026-05-03 02:41:12Incident, confirmed by quorum00:07:12
    2. 2026-05-17 22:00:00Maintenance, announced and excluded01:30:00
    Availability, gross
    99.925%
    After excluding announced maintenance
    99.994%

    Export: PDF report per monitor for 7 to 90 days. CSV with manifest on request.

  9. Your customers see the state before they ask

    Your status page on your own domain shows the state, like this scheduled database upgrade. The page and the badge on your site read from the record behind the availability figure.

    Own domain: Sentinel and above
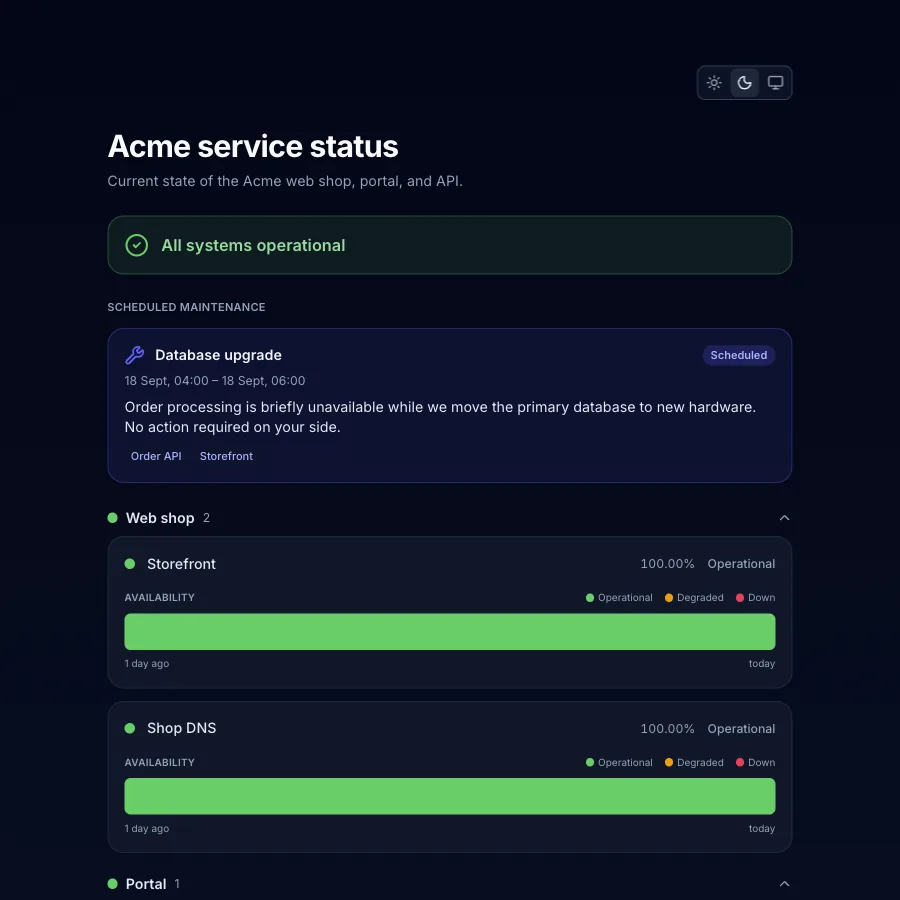
    status.example.comSample data
    A customer-facing status page with grouped components, 90-day availability bars, and a scheduled maintenance notice
    Status badge: operational <img src="https://status.example.com/badge.svg" alt="Service status"> The same badge on your site, served under your domain. It shows what the page shows.
Every check type and its options Open the sample SLA report See Perstat’s public status page

Four documented outages, each with its source

Monitoring shortens the time until you know, keeps a view from outside when your own tools fail, carries the message to your customers, and leaves a record. It does not prevent an outage.

  1. Google Cloud: API layer down worldwide

    The core disruption lasted about 3 hours and occurred globally, and recovery in us-central1 took about 2 h 40 min. Affected products ranged from IAM-dependent services to BigQuery, Cloud Storage, and Vertex AI. Workspace and customers such as Cloudflare were affected too.

    On 29 May, a feature for extra quota policy checks reached Service Control without a feature flag and without error handling on the new path. On 12 June, a policy change produced blank fields, and the binaries crashed worldwide with a null pointer error. Google wrote that its first incident report came about an hour after the crashes began, because the Cloud Service Health infrastructure was itself down. It also wrote that for some customers, the monitoring infrastructure they ran on Google Cloud was failing too, leaving them without a signal of the incident.

    What a check from outside showsThat last sentence makes the case for external monitoring in the operator’s own words: monitoring on the same platform fails with it. Perstat checks from outside, from up to 6 regions with a quorum, and its probe infrastructure does not run on the platform it watches. A status page on separate infrastructure would have informed your customers during that hour.

    Source: Google Cloud incident report, 2025-06-12 · The Register, 2025-06-16

  2. Atlassian: script deleted 883 customer sites

    The outage affected 775 customers for up to 14 days, until the last site was restored. Jira, Confluence, and Access were unavailable for them, and so were Opsgenie and Statuspage. No customer lost more than 5 minutes of data.

    A script meant to delete instances of a retired app received site IDs instead of app IDs and deleted whole customer sites over 23 minutes, starting 07:38 UTC. The first customer ticket arrived at 07:46 UTC, 8 minutes in, and the major incident process started at 08:17 UTC. The first status page update came at 09:03 UTC, 85 minutes in, and the first broad external statement on social media on 7 April, 41 hours in. Restoring took up to 14 days and was only partly automated.

    What a check from outside showsAn HTTP check of your own tenant URL from several regions reports the outage after 2 consecutive failed checks, without waiting for a support ticket. Some customers lost Statuspage and Opsgenie with their sites, so the status page and alerting must not sit with the provider whose outage they are meant to show. No monitoring would have shortened the 14 days.

    Source: Atlassian post-incident review, 2022-04-29

  3. Marketo: domain renewal failed, customers complained publicly

    Sign-in, embedded forms, and images and links in emails were disrupted for every customer, and so were the Salesforce integration and activity tracking. The outage was largely resolved by 12:00 PDT, with propagation effects for 24 to 48 hours.

    The CEO wrote that the company renews thousands of domains every year with precision, yet the auto-renew process for its main domain failed. The statement named human and process error as the cause. Customers complained publicly on Twitter.

    What a check from outside showsA domain check reports the expiry date days ahead, from a system that does not depend on the auto-renewal that failed. A DNS check from several regions would have reported the loss of resolution after 2 consecutive failed checks. A status page on another domain would have carried the message while marketo.com did not resolve, but no check can renew the domain.

    Source: Marketo knowledge base (Adobe), P1 July 25, 2017 · The Drum, 2017-07-26

  4. GitLab.com: database deleted, 5 backup paths failed

    About 18 hours of downtime, most of it restoring. Six hours of data were lost: about 5,000 projects, 5,000 comments, and 700 new accounts. Repositories and wikis were not affected.

    While repairing replication, an engineer removed the data directory on the primary instead of the secondary. The pg_dump backups did not exist, because the script ran pg_dump 9.2 against PostgreSQL 9.6 and failed. GitLab wrote that notifications for failing cron jobs were sent by email, but DMARC was not enabled for those emails, so the receiver rejected them. Disk snapshots were not enabled for the database servers, and all that remained was a manual LVM snapshot, 6 hours old.

    What a heartbeat showsA heartbeat works as a dead man’s switch: the backup job reports after success, and Perstat alerts when the report stays away, whether or not an error email arrives. The case also shows that alerting must not depend on one channel that can fail itself, so escalation should run over several paths and require an acknowledgment. A heartbeat does not check whether the backup can be restored, which stays a job for a restore test.

    Source: GitLab post-mortem, 2017-02-10 · The Register, 2017-02-01, on the 5 backup techniques

Read all documented cases and sources

Perstat replaces checks, status pages, and uptime on-call

Perstat covers the chain from the failing check to the evidence. It is not an observability suite, by design.

  • Uptime checks

    Instead of UptimeRobot, Pingdom, or the uptime checks of a broader suite: 13 check types from named regions.

  • Status page

    Instead of Atlassian Statuspage: public or protected pages, fed by the same monitors and incidents.

  • Uptime on-call

    Instead of the uptime slice of Opsgenie or PagerDuty: acknowledgment on the phone, plus schedules and escalation.

Logs, traces, APM, and alerts from other tools stay where they are. Perstat does not ingest them.

Let pipelines and agents act without risking history

The MCP endpoint that registers monitors also serves agents and scripts. Every write is attributed to the person who created the key, whose current role is checked on each call.

Read the MCP documentation
Write tools over MCPtools/call
  • create_projectCreate a project
  • create_monitorCreate a monitor
  • update_monitorEdit name, settings, interval, or regions
  • set_monitor_enabledPause or resume a monitor
  • archive_monitorArchive a monitor and free its plan slot
  • restore_monitorRestore an archived monitor, paused
  • acknowledge_incidentAcknowledge an incident
  • resolve_incidentResolve an incident
  • delete_monitorDoes not exist, because deleting a monitor would also delete its incident history.
MCP
Read monitors and incidents, create and edit monitors, and acknowledge and resolve incidents. Creating monitors needs an organization-wide API key.
REST and webhook
REST reads for dashboards and reporting, plus a signed webhook for your own automation.
Notifications
Slack, Microsoft Teams, Discord, Google Chat, PagerDuty, and Opsgenie.

Native apps for iPhone, iPad, and Apple Watch

The apps show full-screen alerts, let you acknowledge with a swipe, and put the open incident on the Lock Screen as a Live Activity. There is no native Android app, but SMS from Pulse and on-call phone calls from Sentinel reach any phone.

View in the App Store
25 seconds · no audio
The alarm reaches the on-call responder. Real iPhone app. English recording with example data. Alarm → Silence → Acknowledge. The service remains unavailable until the fault is fixed.

Start free and upgrade without a sales call

Every plan and limit is on the page, Enterprise included. Free, Pulse, Sentinel, and Command are self-service, and Enterprise starts with an inquiry.

Swipe sideways to compare every plan

Compact comparison of the five Perstat plans
What changes with each planFree€0/ monthPulse€29/ monthSentinel€89/ monthOn-call starts hereCommand€249/ monthEnterprisefrom €690/ month
Monitors1050150500custom
Seats131530custom
Shortest interval300 s60 s30 s15 s10 s
Probe regions2 of 63 of 6all 6all 6all 6
Public history*7 days30 days90 days1 year2 years
Status pages11520custom
On-call, manual incidents, post-mortemsnonoincludedincludedincluded

Prices per month in EUR, net, excluding VAT. Enterprise starts at the amount shown. *These values limit the public history of resolved incidents. Other data objects currently follow separate storage and deletion rules. Review the documented retention limits before procurement.

  • EU control plane

    Operated by Datargo GmbH in Germany.

  • Named regions

    Probe locations are listed by name instead of hidden behind a world map.

  • Inspectable status

    Product captures, the public status page, the sample report, and current procurement limits are visible without a login.

Put the monitor into your next deploy

Start on Free with 10 monitors in 2 regions. Create an organization API key and add one step to your pipeline.
