Enter an address
Create an HTTP monitor for your website or API. Choose regions and an interval available in your plan.
Free · €0 / month
10 monitors for websites and APIs, checks from two regions and one status page. Detect outages and keep your customers informed.
No time limit. No credit card. Checks every 5 minutes.
Perstat’s own statusstatus pageCreate an HTTP monitor for your website or API. Choose regions and an interval available in your plan.
Enable push on your iPhone or choose an existing connector. Personal SMS starts at Pulse; on-call with phone calls starts at Sentinel.
Make an endpoint you own fail in a controlled test. Wait for the confirmed outage and check the alert. Then restore the endpoint.
The Test button only checks the monitor. It does not create a stored incident or replace this alert test. Use a test service, not a customer service.
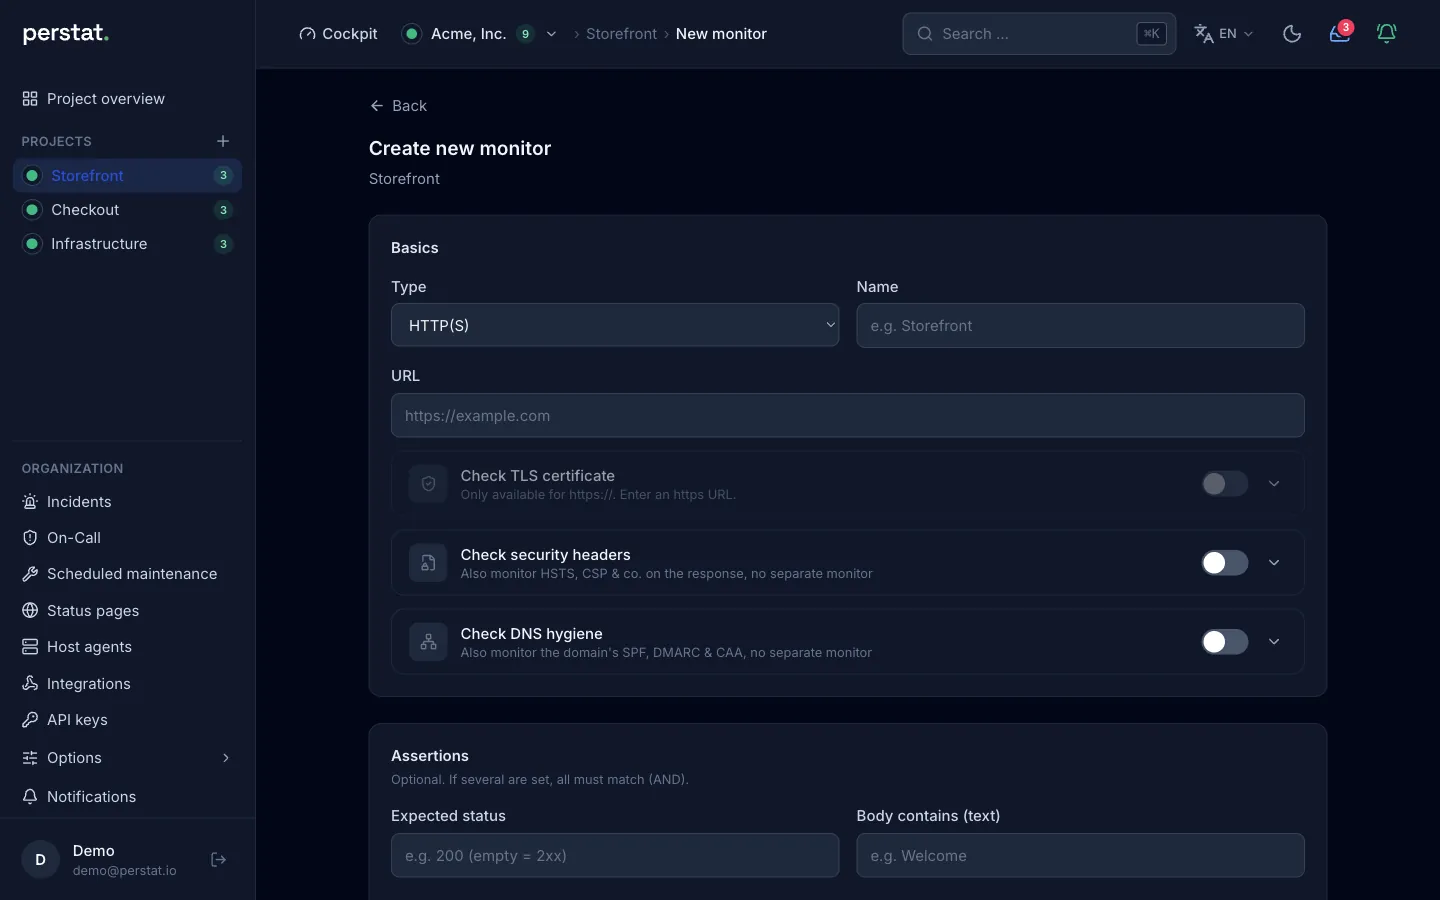
A check fails. Once quorum is reached, Perstat opens an incident. Someone acknowledges it; confirmed recovery closes it. Automatic incidents and acknowledgment are in every plan. On-call with SMS and phone calls starts at Sentinel for €89 net per month.
Open the guideExample: ten clients, each with a project and a status page on its own domain. Sentinel includes five pages; five extra pages total €89 + 5 × €9 = €134 net per month. White-label requires Command at €249 with up to 20 pages.
Projects are not private client consoles. HTTP content checks test one request, not a complete browser checkout or every image on a website.
Open the guideCreate a heartbeat, copy its secret ping URL and send the first ping. Report only genuine success to that URL and failures to the failure URL. To test alerts, let a test job miss its deadline after its first ping.
if /path/to/job.sh; then
  curl --fail --silent --show-error "$PERSTAT_PING_URL"
else
  curl --fail --silent --show-error "$PERSTAT_PING_URL/fail"
  exit 1
fi
Free includes two heartbeats. The signal confirms a job report, not a successful backup restore.
Open the guideFour public incident reports show the value of an outside view.
Check availability from outside your own platform.
Google Cloud
During the cloud outage, some customers’ monitoring failed too.
A check of your customer-facing URL gives you your own outage signal.
Atlassian
The first customer ticket arrived 8 minutes after the outage began.
DNS checks show when a domain name stops resolving.
Marketo
A DNS problem made the sign-in page unreachable.
A heartbeat alerts you when an expected success signal is missing.
GitLab
Backup jobs failed, and their error emails were rejected.
Perstat covers the chain from the failing check to the evidence. It is not an observability suite, by design.
Instead of UptimeRobot, Pingdom, or the uptime checks of a broader suite: 13 check types from named regions.
Instead of Atlassian Statuspage: public or protected pages, fed by the same monitors and incidents.
Instead of the uptime slice of Opsgenie or PagerDuty: acknowledgment on the phone, plus schedules and escalation.
Logs, traces, APM, and alerts from other tools stay where they are. Perstat does not ingest them.
The MCP endpoint that registers monitors also serves agents and scripts. Every write is attributed to the person who created the key, whose current role is checked on each call.
Read the MCP documentationcreate_projectCreate a projectcreate_monitorCreate a monitorupdate_monitorEdit name, settings, interval, or regionsset_monitor_enabledPause or resume a monitorarchive_monitorArchive a monitor and free its plan slotrestore_monitorRestore an archived monitor, pausedacknowledge_incidentAcknowledge an incidentresolve_incidentResolve an incidentdelete_monitorThe apps show full-screen alerts, let you acknowledge with a swipe, and put the open incident on the Lock Screen as a Live Activity. There is no native Android app, but SMS from Pulse and on-call phone calls from Sentinel reach any phone.
View in the App StoreFree costs €0 per month with no time limit. Pay for more monitors and additional features when you need them.
€0 per month. 10 monitors, two heartbeats and one status page. Automatic incidents and acknowledgment included.
Personal SMS, 50 monitors and three seats. €29 net/month.
Rotations, SMS and calls, 150 monitors and 15 seats. €89 net/month.
Custom status domains from €89, white-label from €249 net/month. Check page allowances.
Swipe sideways to compare every plan
| What changes with each plan | Free€0/ monthNo time limit | Pulse€29/ month | Sentinel€89/ month | Command€249/ month | Enterprisefrom €690/ month |
|---|---|---|---|---|---|
| Monitors | 10 | 50 | 150 | 500 | custom |
| Seats | 1 | 3 | 15 | 30 | custom |
| Shortest interval | 300 s | 60 s | 30 s | 15 s | 10 s |
| Probe regions | 2 of 6 | 3 of 6 | all 6 | all 6 | all 6 |
| Public history* | 7 days | 30 days | 90 days | 1 year | 2 years |
| Status pages | 1 | 1 | 5 | 20 | custom |
| On-call, manual incidents, post-mortems | no | no | included | included | included |
Prices per month in EUR, net, excluding VAT. Enterprise starts at the amount shown. *These values limit the public history of resolved incidents. Other data objects currently follow separate storage and deletion rules. Review the documented retention limits before procurement.
Operated by Datargo GmbH in Germany.
Probe locations are listed by name instead of hidden behind a world map.
Product captures, the public status page, the sample report, and current procurement limits are visible without a login.
A sample agent conversation shows the setup. The Perstat images are real product views with sample data, not a recording of this conversation.
Your website or API is ready to go live. Ask your connected coding agent to include monitoring, without opening a second setup form.
The example assumes Perstat is connected and the agent has permission to manage this project.
Explore uptime monitoringThe agent can create a URL monitor over MCP or update an existing one. It reports what was configured in the conversation.
Monitor creation is separate from the first check. Intervals and regions depend on your plan.
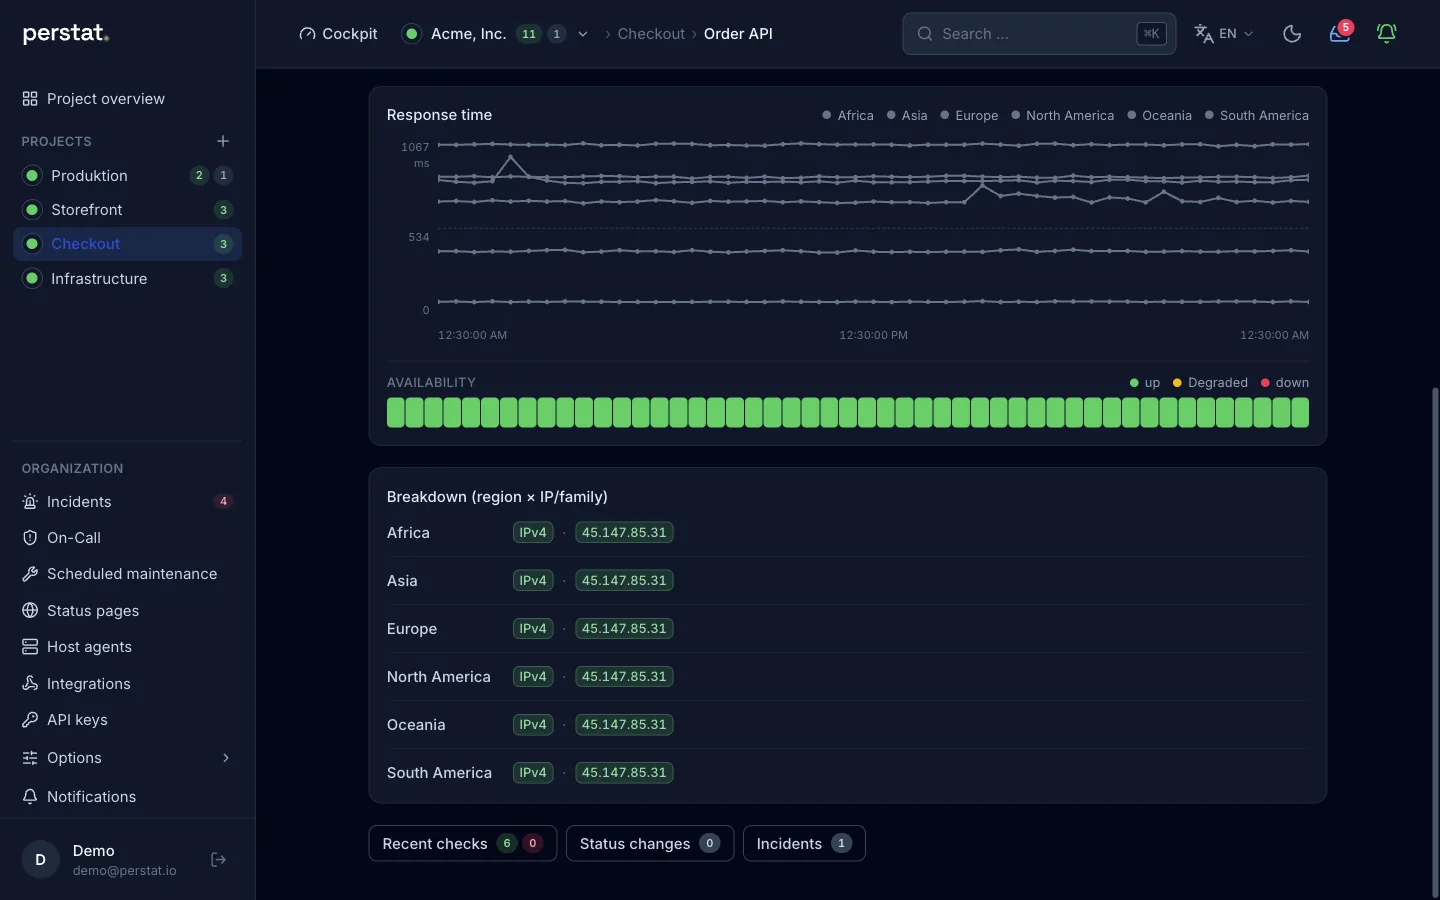
Explore uptime monitoringPerstat checks the URL from outside your service. Results and response times appear in the monitor, even after you close the coding agent.
A successful HTTP check verifies the configured endpoint. It does not test an entire checkout journey.
Explore uptime monitoring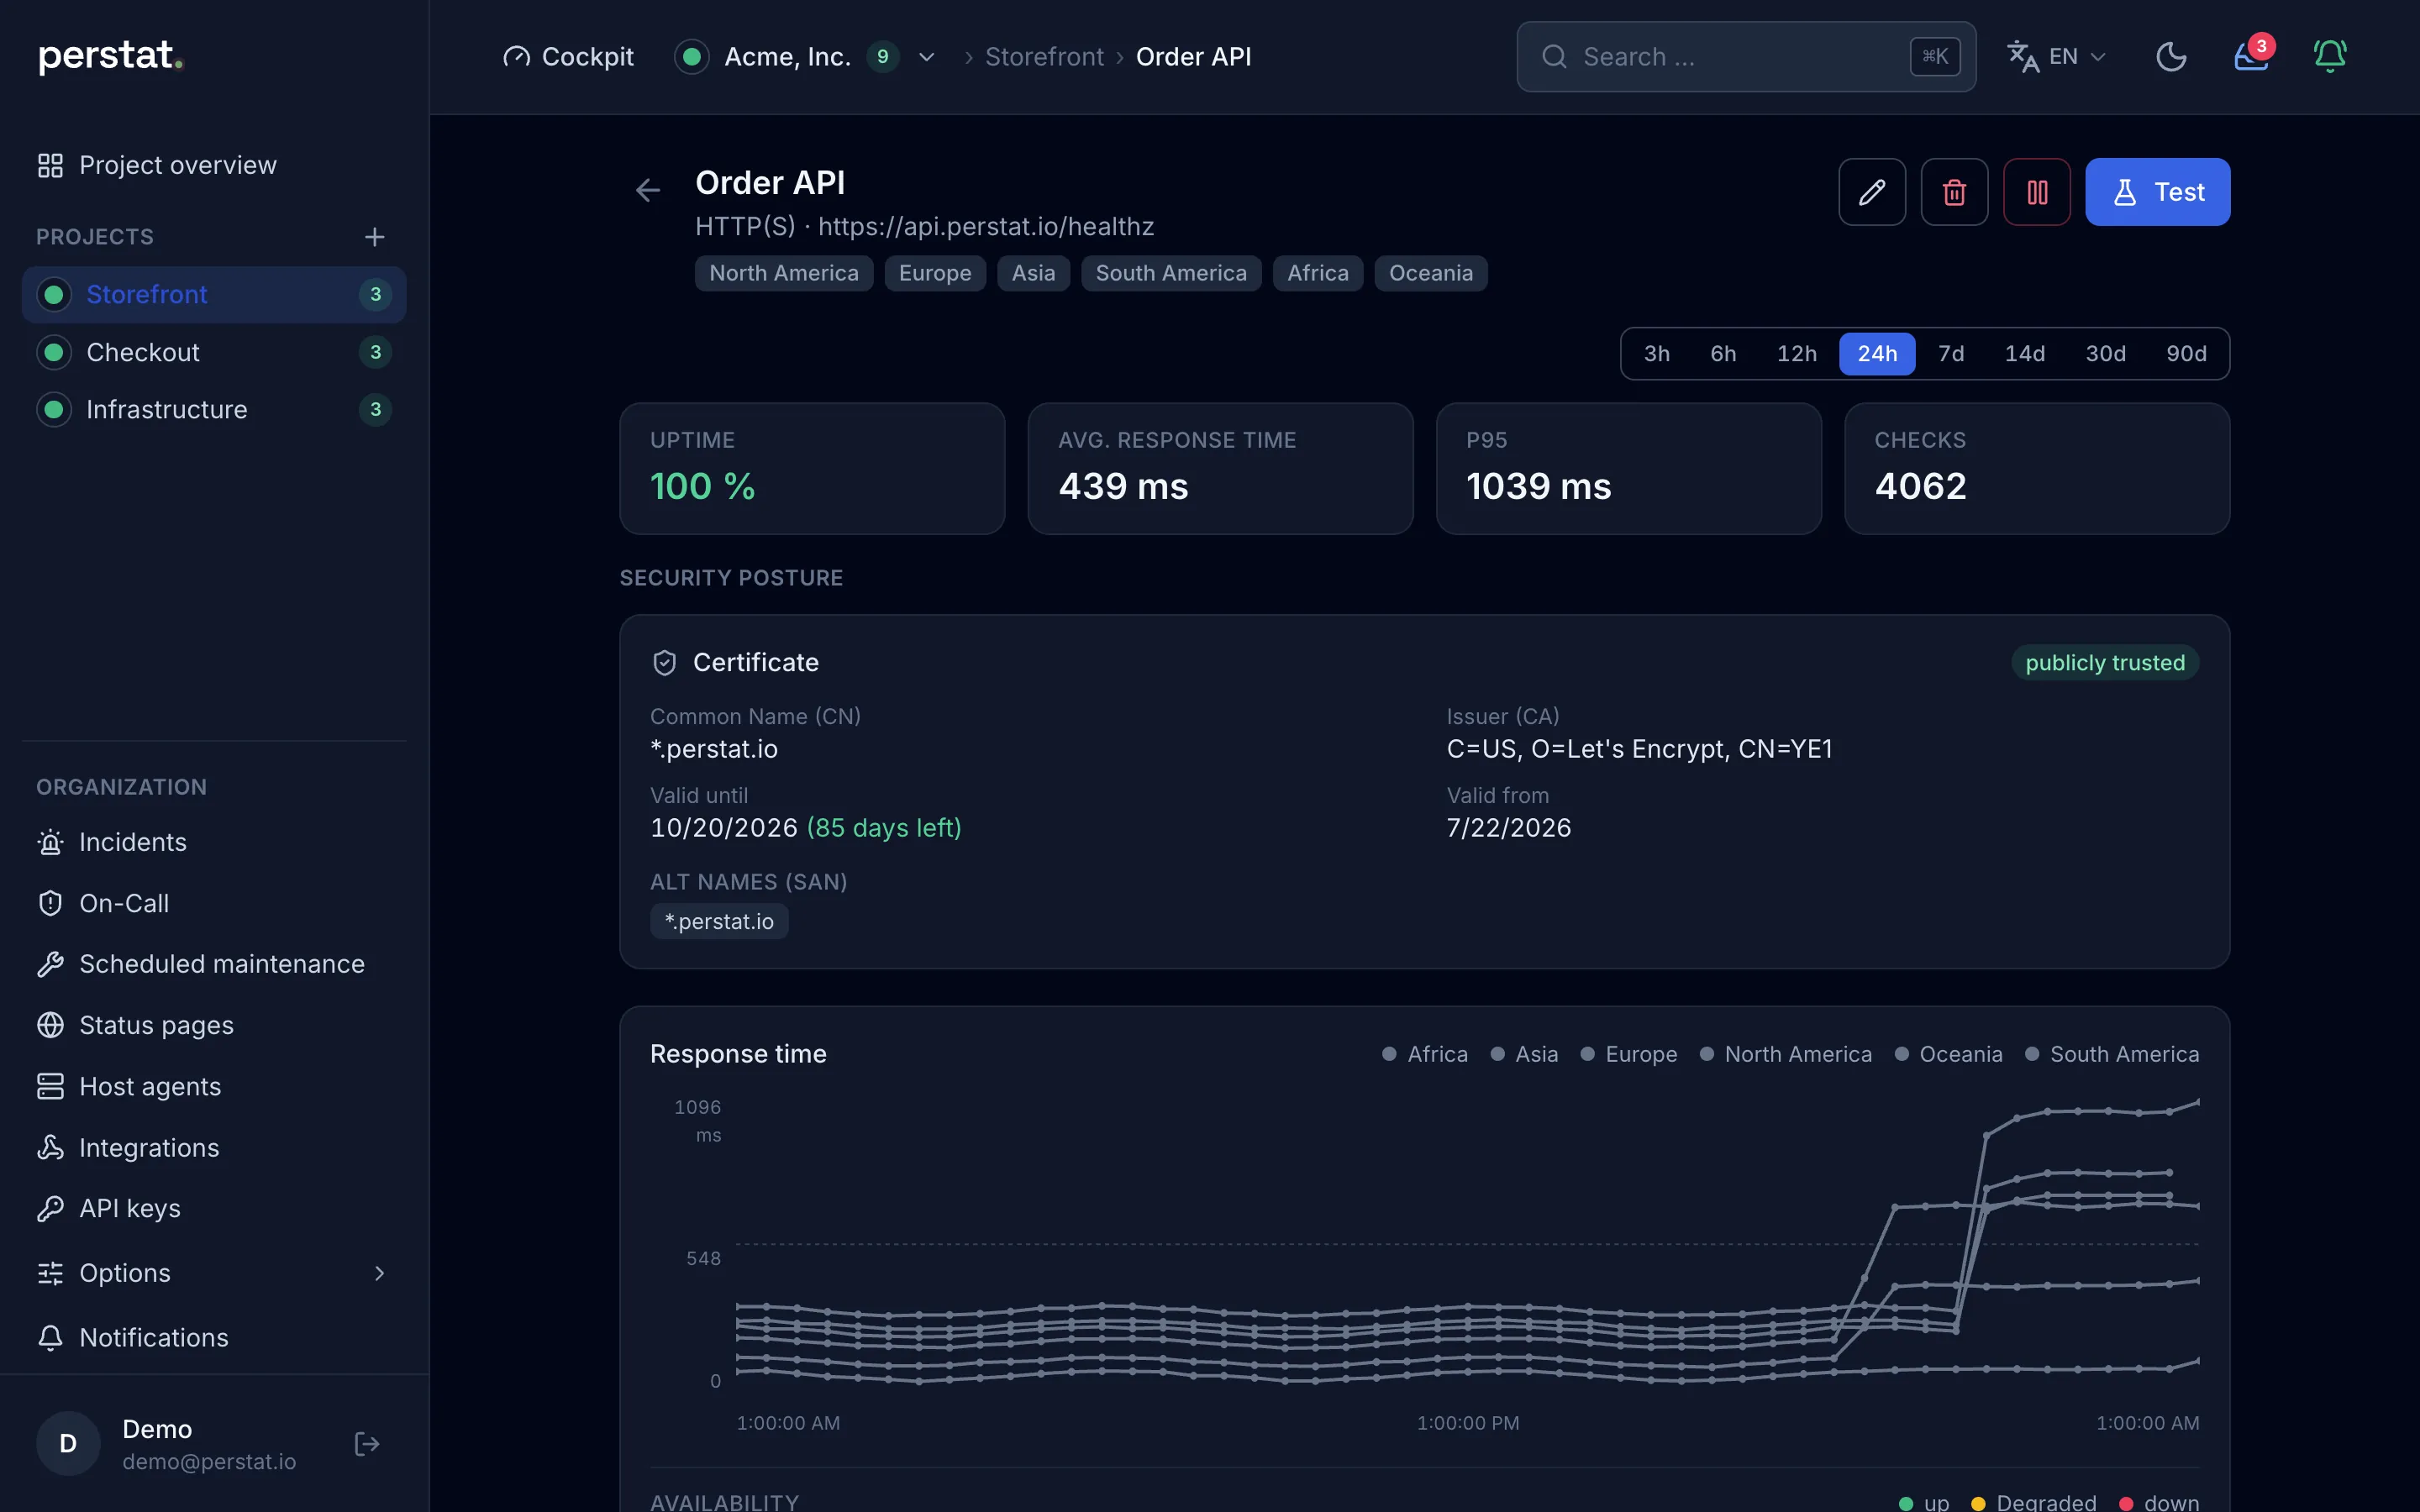
When the configured failure rules are met, Perstat opens an incident and notifies you through your configured channels.
Regional checks require confirmation from two regions by default. Acknowledging an alert does not repair the service.
Explore uptime monitoring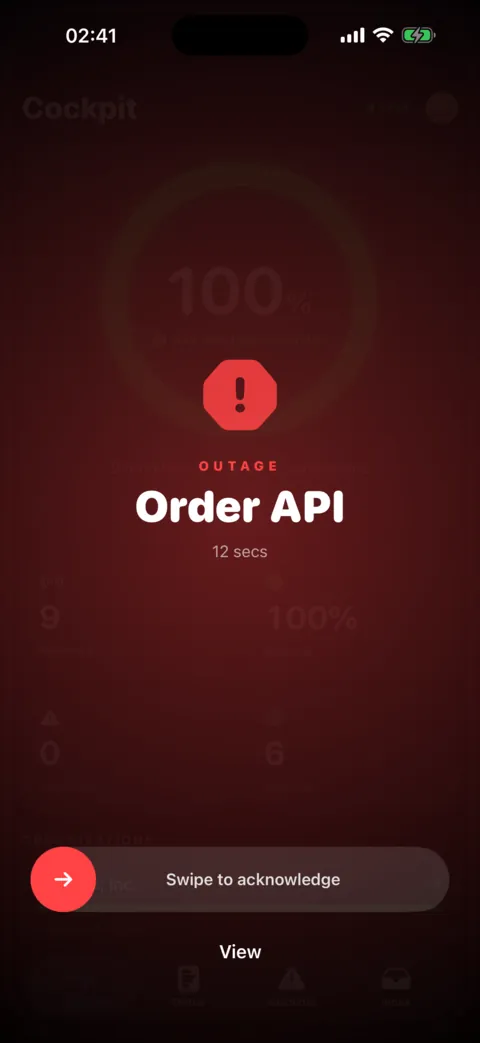
A job may stop running while its server still responds. A heartbeat tells Perstat when that job reports in.
This example follows a scheduled report. The same pattern can monitor a backup job.
Explore heartbeat monitoringCreate the heartbeat and add its private ping address to the job. Send the success signal after the job finishes successfully.
Keep the address secret. MCP support depends on the connected server and client version.
Explore heartbeat monitoringRun the job and check that Perstat received its signal. Future runs report on the same schedule.
A backup heartbeat confirms the job signal. It does not verify that a backup can be restored.
Explore heartbeat monitoringIf the next signal is late beyond the expected interval and grace period, Perstat can open an incident and notify the configured recipients.
Heartbeat checks use the job schedule, without regional quorum.
Explore heartbeat monitoringAPI and MCP are additional setup options. The sequence below is a labelled example.
Skip the storyorder-api 2.16.0 adds a payments webhook. Of the last 8 deploys, 3 shipped an endpoint, a job, or a service without a monitor, because creating one was a separate task.
09-10 11:47search-indexer 1.9.3worker poolmonitored09-09 09:15auth-service 3.1.1token rotationmonitored09-08 10:05mail-relay 1.4.2patchmonitored09-05 15:30order-api 2.15.4patchmonitored09-05 08:12status-sync 0.3.0cron jobmonitored3 of 8 deploys added something without a monitor
A step after the release job creates the monitor through the REST API. Use an organization API key with monitors:write and access to the project. HTTP errors fail the job.
# after the release job: register the monitor
- name: Register monitor
  run: |
    curl --silent --show-error --fail-with-body \
      "https://api.perstat.io/projects/$PERSTAT_PROJECT_ID/monitors" \
      --header "Authorization: Bearer $PERSTAT_API_KEY" \
      --header "Content-Type: application/json" \
      --data '{
        "name": "Order API", "type": "http",
        "config": {"url": "https://orders.example.com/health"},
        "interval_seconds": 300,
        "regions": ["na", "eu", "as", "sa", "af", "oce"]
}'The API returns the monitor with its ID. Keep that ID and use PATCH for later changes. Creating the same name again returns a conflict; it does not silently count as success.
{
  "id": "mon_…",
  "name": "Order API",
  "type": "http",
  "enabled": true,
  "interval_seconds": 300,
  "regions": [
    "na",
    "eu",
    "as",
    "sa",
    "af",
    "oce"
  ]
}Update the saved monitor ID with PATCH /monitors/{monitor_id}.
Probe nodes on 6 continents run the check at its interval. Perstat stores every result with the region that measured it.
naNorth AmericasaSouth AmericaeuEuropeafAfricaasAsiaoceOceaniaA failure in one region is a quiet notice, not a page. When a second region reports a failure too, the default quorum confirms the outage and opens exactly one incident.
naewrNewarkOKFailedsagruSão PauloOKeufraFrankfurtOKafjnbJohannesburgOKassgpSingaporeOKFailedocesydSydneyOKna (Newark) reports a failure: a quiet notice, nobody is paged yet.
as (Singapore) reports a failure too: quorum reached, incident opened at 02:41:12 UTC.
Perstat alerts iPhone and Apple Watch, and Slack, Teams, or PagerDuty through connectors. On-call escalation moves on to SMS and a phone call until someone acknowledges.
On-call escalation: Sentinel and above
Personal SMS alerts without a rotation: Pulse and above
acknowledge_incidentOr from the terminal: your agent calls acknowledge_incident over MCP, attributed to the owner of the key.
The incident opened by the quorum appears on the linked status page with its current phase, and the component switches to Down. Nobody has to copy it over by hand.
02:41:12 UTCWhen the regions report recovery, the incident closes with its confirmed start, end, and duration. Announced maintenance is excluded for its window. Perstat calculates availability from the same record.
Order APIQ2 20262026-05-03 02:41:12Incident, confirmed by quorum00:07:122026-05-17 22:00:00Maintenance, announced and excluded01:30:00Export: PDF report per monitor for 7 to 90 days. CSV with manifest on request.
Your status page on your own domain shows the state, like this scheduled database upgrade. The page and the badge on your site read from the record behind the availability figure.
Own domain: Sentinel and above
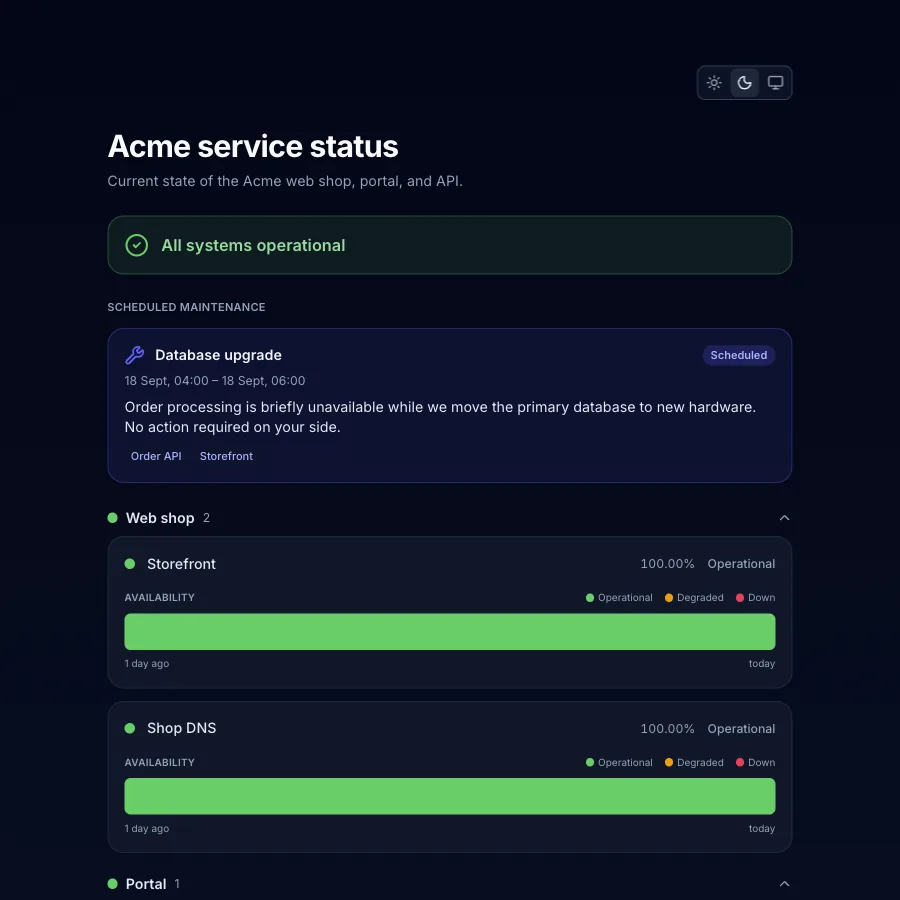

<img src="https://status.example.com/badge.svg" alt="Service status">
The same badge on your site, served under your domain. It shows what the page shows.Start with a website or API. Free includes 10 monitors, two check regions and one status page, with no credit card or time limit.
