On this page
What it verifies
A host agent monitor binds to one agent installed on one of your hosts and watches one metric. availability watches whether the agent still checks in. cpu, mem, and disk compare usage in percent with a threshold, and service checks that a named process is running. The agent reports to the control plane, and the server judges the latest report about every 30 s. A breach opens an incident, with a push per notify_push, or raises only an in-app notice, as breach_severity says. One agent carries several monitors, one per metric or process.
Use it when
- A host runs something with no port to probe, or the port still answers while the host is out of memory or disk.
- A process must keep running: a database, a queue worker, or a reverse proxy. A restart shorter than the grace does not count as a breach.
- A host should raise an alarm when it stops reporting at all, with a grace so a reboot inside the grace opens no incident.
The check measures nothing over the network. Reachability of a port or URL from the internet needs the ping, TCP, or HTTP(S) check. A cron job or batch run without a process to watch needs the heartbeat check.
Configuration
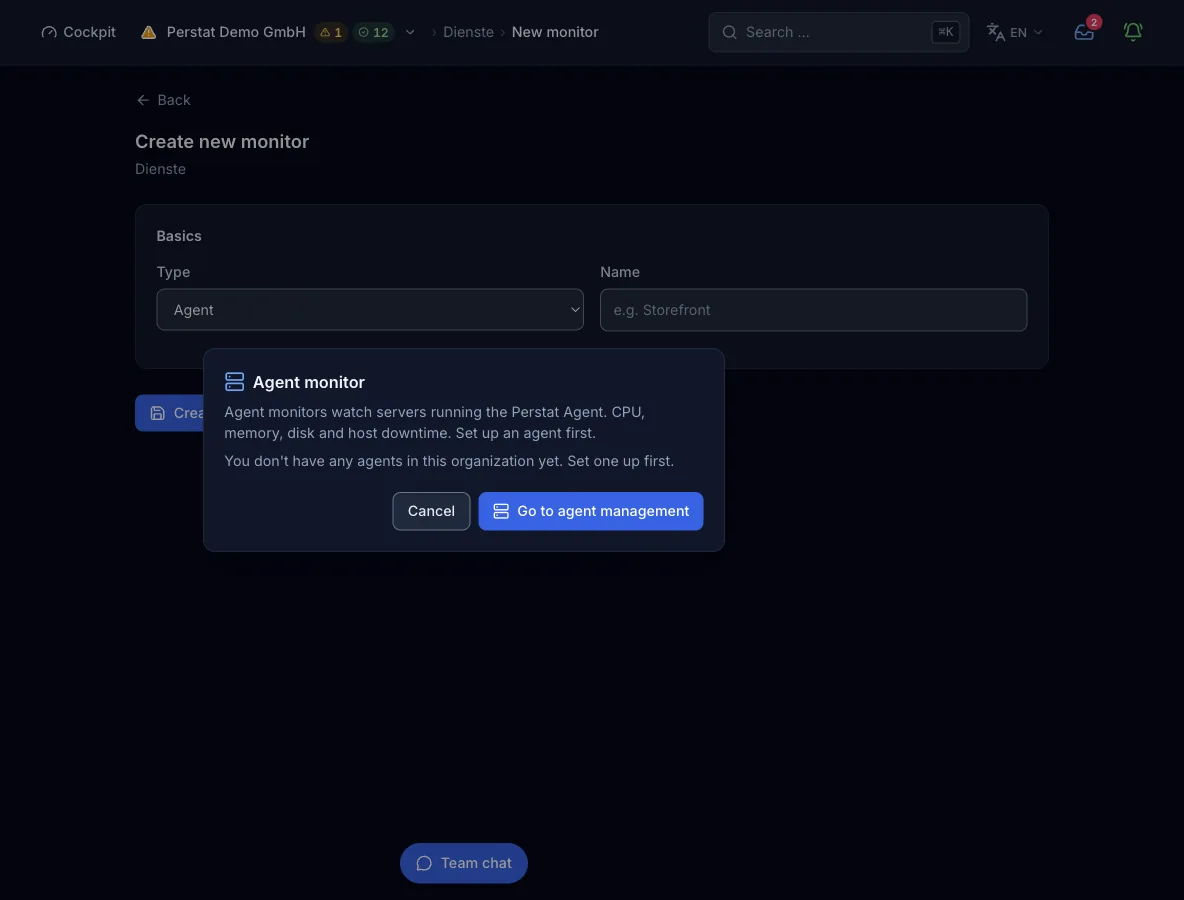
Agent. No network target. The monitor binds to one host agent of your organization by its agent_id, and the form lists the registered agents. The report comes from the host, so the check takes no regions, no IP families, and no interval of its own.
| Field | Required | Values and default | Meaning |
|---|---|---|---|
agent_idAgent | yes | Public ID of an agent registered in your organization | Which host the monitor watches. The form lists the registered agents, and the API and MCP take the ID. |
metricMetric | yes | availability, cpu, mem, disk, service | What the server judges: agent check-ins, a usage value in percent for CPU, memory, or disk, or a running process. One monitor watches one metric. |
thresholdThreshold | optional | Percent, 0 to 100, default 90. Used by cpu, mem, and disk | A value above the threshold is a breach. Ignored by availability and service. |
grace_seconds | optional | 60 to 3600 s. Default 180 for availability, 120 for service | How long the agent may stay silent, or the process stopped, before the pass counts a breach. A shorter gap does not count. It is set over the API or MCP, and the form keeps the stored value when you edit. |
service_nameService name | optional | 1 to 64 characters of letters, digits, ., _, and -. Required with service | The process name on the host, for example nginx. The pass looks for a fresh entry of that name in the agent’s report. |
breach_severitySeverity | optional | critical (default) or degraded | critical records a failed check and opens an incident, with a push per notify_push. degraded records a degraded check and raises only the in-app notice. |
notify_pushPush notification | optional | true (default) or false | Send a push notification on a critical breach. It has no effect at degraded. |
How a check runs
- The agent on the host reports to the control plane. About every 30 s, the server loads the agent’s latest report for this monitor. No probe region takes part, and the check never touches the host over the network.
availability: the server compares the age of the last report withgrace_seconds. A report older than the grace is a breach.cpu,mem,disk: judged only while the last report is at most 180 s old, and a value abovethresholdis a breach. Without a fresh value, the pass records no result instead of a false alarm. The silent host is the job of theavailabilitymetric.service: judged only with a fresh report and a fresh entry for the named process. A process that has not been running for longer thangrace_secondsis a breach.breach_severitydecides what a breach becomes: failed with severity critical, or degraded. Critical opens an incident with a push pernotify_push, and degraded raises an in-app notice only. Alarm and recovery are fixed at 1 evaluation each, so the next pass decides.
What a result contains
- State and severity
- passed, degraded, or failed, with severity ok, degraded, or critical. The region is
agent, the marker of a server-side check. - Detail line
- One line with the judged fact. It shows the age of the last report against the grace, the value against the threshold (
CPU 95% > 90%), or the process with its process count and CPU share. - Latency and response code
- Nothing is measured over the network, so a result carries neither a response time nor a status code.
States and severity
- okThe last report is within the grace, the value is at or below the threshold, or the process is running.
- degradedA breach with
breach_severityset todegraded. It is recorded and shown as an in-app notice, with no incident and no push. - downA breach with
breach_severityset tocritical, the default. The agent stayed silent past the grace, a value rose above the threshold, or the process stopped for longer than the grace. It opens an incident, with a push pernotify_push. - errorAppears only in a test run. When the metric cannot be judged, for example without a fresh report, the run answers error with a diagnosis. Nothing is stored and no incident opens.
- pendingNo result yet, right after creation or while the agent has sent no fresh value for the metric. The pass records nothing rather than a false alarm.
The signal comes from your host or your job, without regions or quorum, so one missed report counts. Alarm and recovery are fixed at 1 evaluation each. The pass that sees the breach opens the incident, and one passing evaluation counts as recovery.
Plans and limits
- Host agents
- 2 on Free, 10 on Pulse, 50 on Sentinel, and 200 on Command. Enterprise quotas are custom. An add-on pack adds 10 agents for €19.
- Monitors per agent
- 25 on Free, Pulse, Sentinel, and Command. Enterprise quotas are custom. A host agent monitor counts here, not against the probe monitor quota.
- Interval and regions
- Not applicable. The server evaluates about every 30 s, and the plans’ interval floors and region counts do not apply to this type.
From the pipeline or an agent
The same config works in the deploy step, in an MCP client such as Claude Code, and in the form above. create_monitor needs an organization-wide API key. If you omit regions, the plan picks its default.
{
  "name": "web-01 CPU",
  "type": "agent",
  "config": {
    "agent_id": "agt_...",
    "metric": "cpu",
    "threshold": 90,
    "breach_severity": "degraded",
    "notify_push": true
  }
}
Every interface, with its boundary
Limits
- The agent reports four metrics (availability, CPU, memory, and disk) and the state of a named process. Other metrics and custom values are not available.
- CPU, memory, and disk are not judged while the agent is silent. Pair a threshold monitor with an
availabilitymonitor on the same agent to catch the silent host. grace_secondsis set over the API or MCP. The form keeps the stored value when you edit.- The type has no interval, regions, or alert policy of its own, and the form hides all three. The server evaluates all agent monitors in one pass about every 30 s and ignores
regionsin a request.interval_secondsis stored on an edit and shown in the monitor, but the evaluation reads neither that value nor the 60 s set at creation. agent_idmust name an agent already registered in your organization. The ID comes from the agent registration, and the monitor does not create it.