On this page
What it verifies
A heartbeat monitor verifies that a job ran when it should. Creating the monitor mints a secret URL, and the job requests it at the end of every run. About every 30 s, the control plane compares the age of the last ping with the expected period plus grace. A ping older than that, or a last ping that hit the failure URL, is a breach. Until the first ping arrives, the monitor is pending, not down.
Use it when
- A scheduled job has no address to probe: a cron run, a nightly backup, an importer, or a worker that must finish on time.
- The failure you need to see is that something did not happen. A job that never started leaves nothing broken that a probe could reach.
- The job can judge its own run. It calls the ping URL after success and the failure URL when its own checks fail. The monitor then goes down at the next evaluation, without waiting out the schedule.
The check records only when the call arrives. A service that listens on a port needs the HTTP(S) or TCP check. CPU, memory, disk, and processes of the host itself need the host agent check.
Configuration
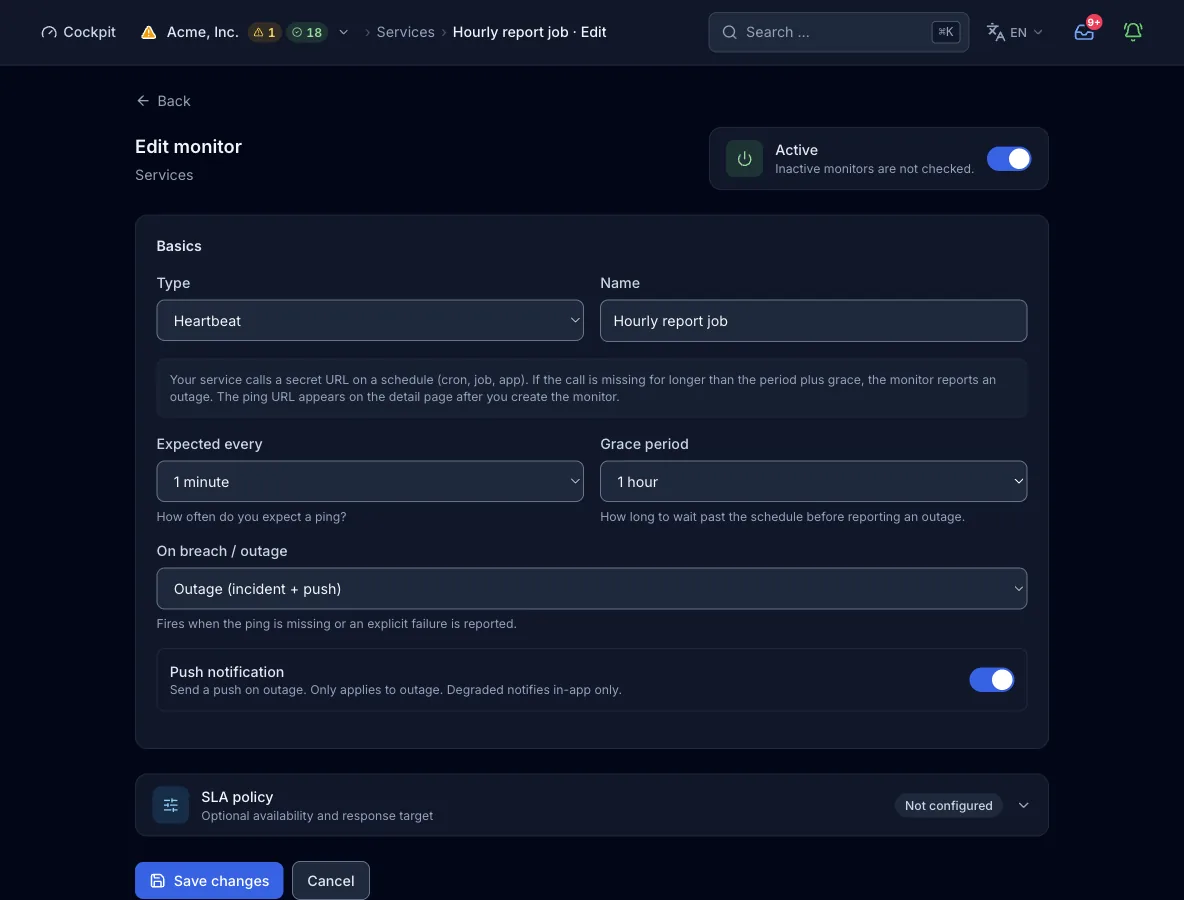
Target. None. A heartbeat has no target, no probe regions, no IP families, and no check interval of its own. The form hides those fields, and the control plane evaluates the monitor about every 30 s under the pseudo-region heartbeat. Creating the monitor mints the secret URL https://api.perstat.io/ping/{token}; the monitor view shows it together with the failure URL (/fail appended).
| Field | Required | Values and default | Meaning |
|---|---|---|---|
period_secondsExpected every | optional | Seconds, 30 to 2,592,000 (30 days), default 3600 | How often the job is expected to ping. The form offers presets, and the API normalizes any number of seconds into the range. |
grace_secondsGrace period | optional | Seconds, 0 to 86,400 (24 h). Default: one fifth of the period, kept between 60 and 3600 | How long a ping may still arrive after the period before the monitor counts a breach. A value of 0 sets a hard deadline. Set the grace to a real fraction of the period, because a nightly backup with 60 s of grace pages on every slow night. |
breach_severityOn breach / outage | optional | critical (default) or degraded | critical marks the monitor down and opens an incident, with a push per notify_push. degraded marks it degraded with an in-app notice only, and any other value is stored as critical. |
notify_pushPush notification | optional | true (default) or false | Send a push notification on an outage at critical. A degraded breach notifies in-app regardless. |
How a check runs
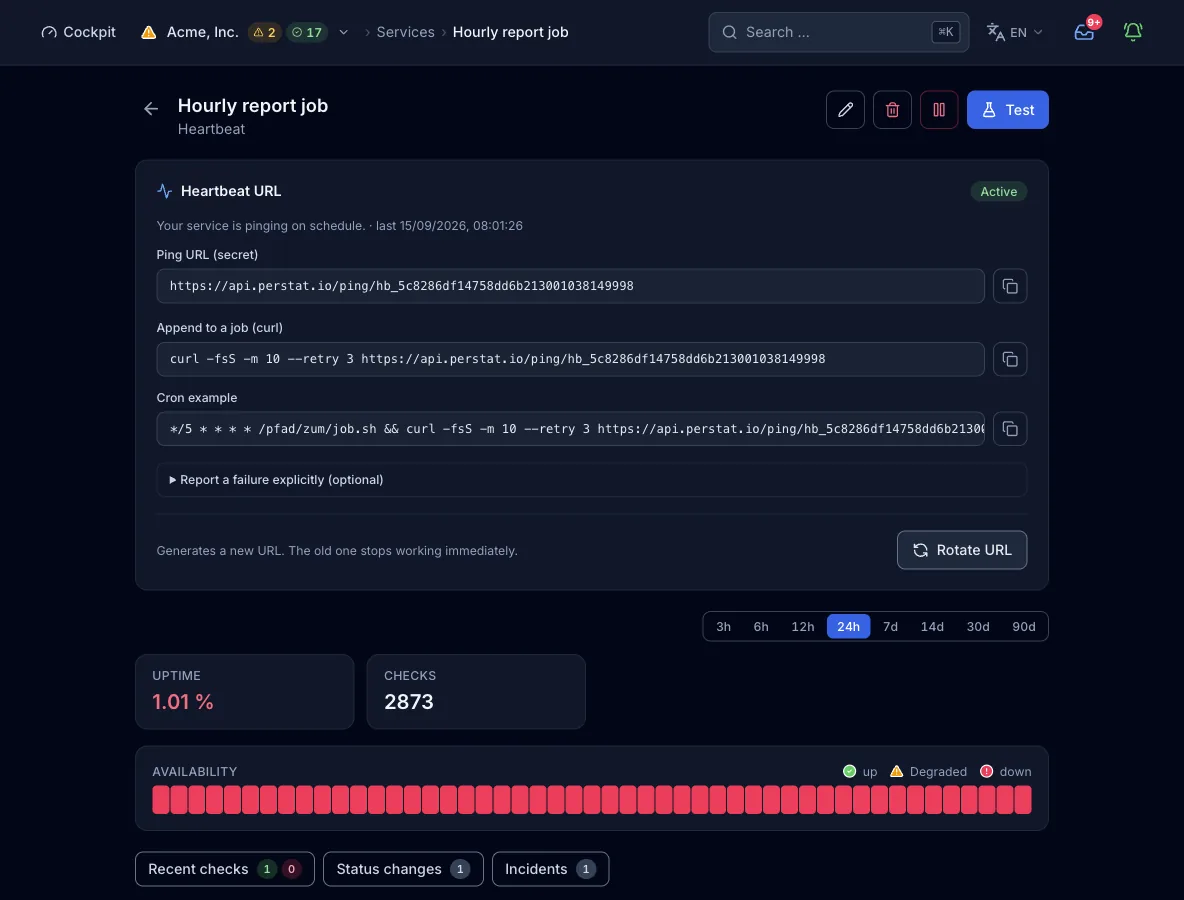
- Creating the monitor mints the token, and the monitor view shows the ping URL and the failure URL. Wire the ping URL into the job, for example as the last command of the cron line.
- The job requests the ping URL with GET or POST when a run finishes. When the run decides it failed, the job requests the failure URL instead.
- About every 30 s, the control plane evaluates the monitor. Until the first ping, it stays pending and no result is written.
- A last ping that hit the failure URL is a breach. So is a last ping older than period plus grace.
- A breach takes the configured severity.
criticalmarks the monitor down and opens an incident, with a push if enabled, anddegradedmarks it degraded with an in-app notice only. Alarm and recovery are fixed at 1 check each, so the next healthy ping resolves the incident at the next evaluation. - The Test button runs the same evaluation on demand and shows the result to you alone. Nothing is stored and no incident is opened.
What a result contains
- Status and severity
- passed, failed, or degraded, with severity ok, degraded, or critical. A heartbeat that has never pinged shows pending.
- Detail line
- One line that says what happened. It reports a current heartbeat with the age of the last ping, no heartbeat for N seconds against the expected period and grace, or a failure the job reported.
- Last ping
- The heartbeat panel of the monitor view shows the time of the last ping. It sits in the status line above the ping URL, next to the Active or Waiting badge. The detail line of the next evaluation, not the panel, reports whether that ping was healthy or a failure.
- Region
- Every result carries the pseudo-region
heartbeat. There is no latency, no response code, and no sub-result.
States and severity
- okThe last ping arrived within period plus grace and was a healthy ping.
- degradedA breach with
breach_severityset todegraded. It raises an in-app notice, with no incident and no push. - downA breach at the default severity
critical: the last ping is older than period plus grace, or the job called the failure URL. It opens an incident, with a push pernotify_push. - pendingNo ping has arrived yet. The monitor shows pending until the job calls the URL for the first time.
The signal comes from your host or your job, without regions or quorum, so one missed report counts. The control plane evaluates about every 30 s, with alarm and recovery fixed at 1 check each. A breach becomes an incident at the next evaluation after period plus grace has elapsed.
Plans and limits
- Evaluation interval
- About 30 s on every plan, set by the server. The plan’s interval floor applies to probe types only.
- Regions
- None. The job reports in and nothing is probed, so the plan’s region count does not apply.
- Heartbeats
- 2 on Free, 10 on Pulse, 50 on Sentinel, and 200 on Command. Enterprise quotas are custom. Heartbeats have a quota of their own and consume no probe monitor slot. A pack of 25 more costs €9.
From the pipeline or an agent
The same config works in the deploy step, in an MCP client such as Claude Code, and in the form above. create_monitor needs an organization-wide API key. If you omit regions, the plan picks its default.
{
  "name": "Nightly backup",
  "type": "heartbeat",
  "config": {
    "period_seconds": 86400,
    "grace_seconds": 1800,
    "breach_severity": "critical",
    "notify_push": true
  }
}
Every interface, with its boundary
Limits
- Nothing is measured but the time of the call, with no runtime, no exit code, and no payload.
- Until the first ping, the monitor is pending. A heartbeat that no job calls looks like coverage and is none.
- The ping URL is unauthenticated, so whoever holds the token can ping. Treat it like a credential. If it leaks, rotate it in the monitor view, and the old URL stops working at once.
- The ping endpoint accepts 240 requests per 60 s per source IP. An unknown token gets 404.
- A create request over the API or MCP does not return the ping URL. Read it from the monitor view and wire it into the job.
- The evaluation runs about every 30 s, so a breach is noticed up to about 30 s after period plus grace has elapsed.