On this page
What it verifies
A traceroute monitor runs the system traceroute against the host from each of its regions at every interval. It sends one probe per hop with a 2 s wait and follows up to 20 hops by default. The result holds the hop count and the last line, and the target counts as reached when that last hop answered. The type measures no response time and passes no availability verdict. An unreached target is degraded, not down, and never opens an incident.
Use it when
- A ping or HTTP(S) check next to it fails, and you want a per-region record of whether the path still reached the target at that moment.
- A host answers from some regions but not from others, and you want the hop count and last hop of each region on the record.
- The hop count and the last hop line should be logged with every check, per region, so a routing change has a timestamp.
A traceroute result is not an availability verdict. A target that filters the final hop reports degraded, never down, and an unreached path opens no incident. For reachability, use the ping check, and for a service answer, the HTTP(S) or TCP check.
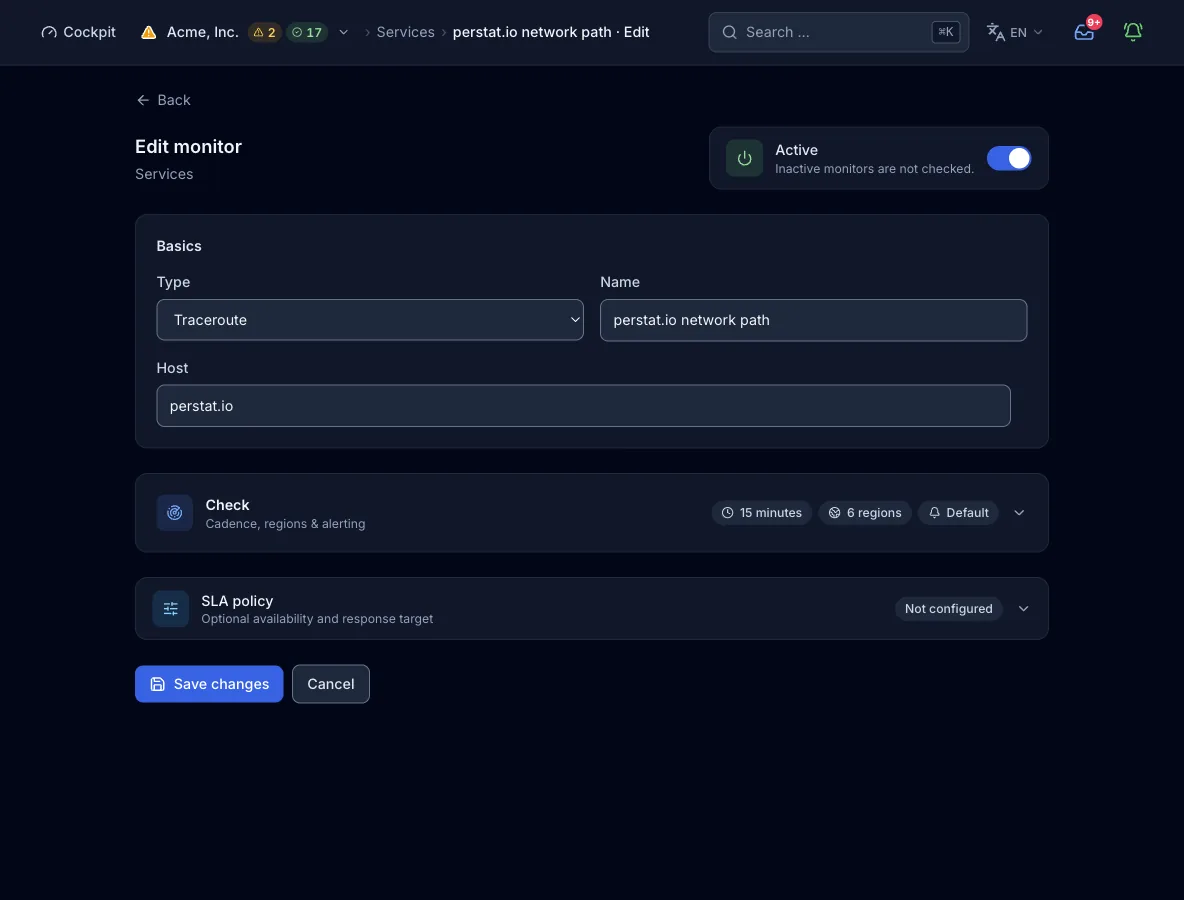
Configuration
Target. A hostname or an IP address, without a port. The node resolves the first address of the chosen family through its own resolver and validates it. Loopback, private, link-local, and cloud metadata addresses are refused, so the monitor cannot be pointed into an internal network.
| Field | Required | Values and default | Meaning |
|---|---|---|---|
hostHost | yes | Hostname or IP address | The host the route is traced to, one address per family. The node checks the first address of that family against the blocklist, then runs traceroute on the host name, pinned to the family. |
max_hops | optional | Default 20 | The maximum number of hops, passed to traceroute as -m. It is set over the API or MCP, and a monitor created in the form runs with 20. |
interval_secondsCheck interval | optional | Default 300. Raised to the plan’s floor, capped at 24 h | How often each region runs the check. The form offers presets from 30 s to 1 h, and intervals of 15 s or 10 s need MCP. |
regionsRegions | optional | Subset of na, eu, as, sa, af, oce. Default: the first n of that list, n = the plan’s region limit | Which continents run the check. More regions than the plan allows are rejected, not trimmed. |
address_familiesIP families | optional | ["ipv4"] (default), ["ipv6"], or ["ipv4", "ipv6"] | Trace the route over one or both families, one address each. With both, family_fail_severity decides what one unresolved or blocked family means. |
IP families
The route is traced per IP family, one address each, and every family becomes its own sub-result. A family whose address does not resolve or is blocked fails. One such family out of two is judged by family_fail_severity, and two such families fail the check. A family that resolves but does not reach the target is degraded, and the check takes the worse of the two. The form offers IPv6 only when the host has an AAAA record or is an IPv6 literal, and then only regions that probe IPv6 stay selectable.
| Field | Required | Values and default | Meaning |
|---|---|---|---|
address_families | optional | ["ipv4"] (default), ["ipv6"], or ["ipv4", "ipv6"] | Which families are traced. Empty or missing means IPv4 only. |
family_fail_severity | optional | degraded (default) or failed | What one failing family out of two does to the monitor’s state. |
How a check runs
- Each region due for the interval resolves the host through the node’s own resolver. It takes the first address of the chosen family and validates it against the blocked ranges.
- The node runs the system traceroute against the host, pinned to that family. It uses numeric output, one probe and a 2 s wait per hop, and at most
max_hopshops. The whole run may take up to 20 s, the larger of 20 s and the monitor’s 10 s time limit. - The output is read: the header line is dropped, the hop lines are counted, and the last line is kept.
- The target counts as reached when the last line carries no
*, that is, when the final hop answered. Otherwise, or when no hop line came back, the result is degraded. - The region’s result goes to the control plane. The alert policy then decides, by its quorum, whether a failed resolution or a blocked target becomes an incident. A degraded path does not open one.
What a result contains
- Hop count
- How many hop lines the run produced, per region and per family.
- Last hop
- The last line of the traceroute output, verbatim. It is the target’s hop when the target was reached, or a
*line when the final hop stayed silent. - Detail line
- One line per check that carries the hop count and the last hop.
- Reached or not
- Whether the final hop answered. This decides between ok and degraded.
- Region and family
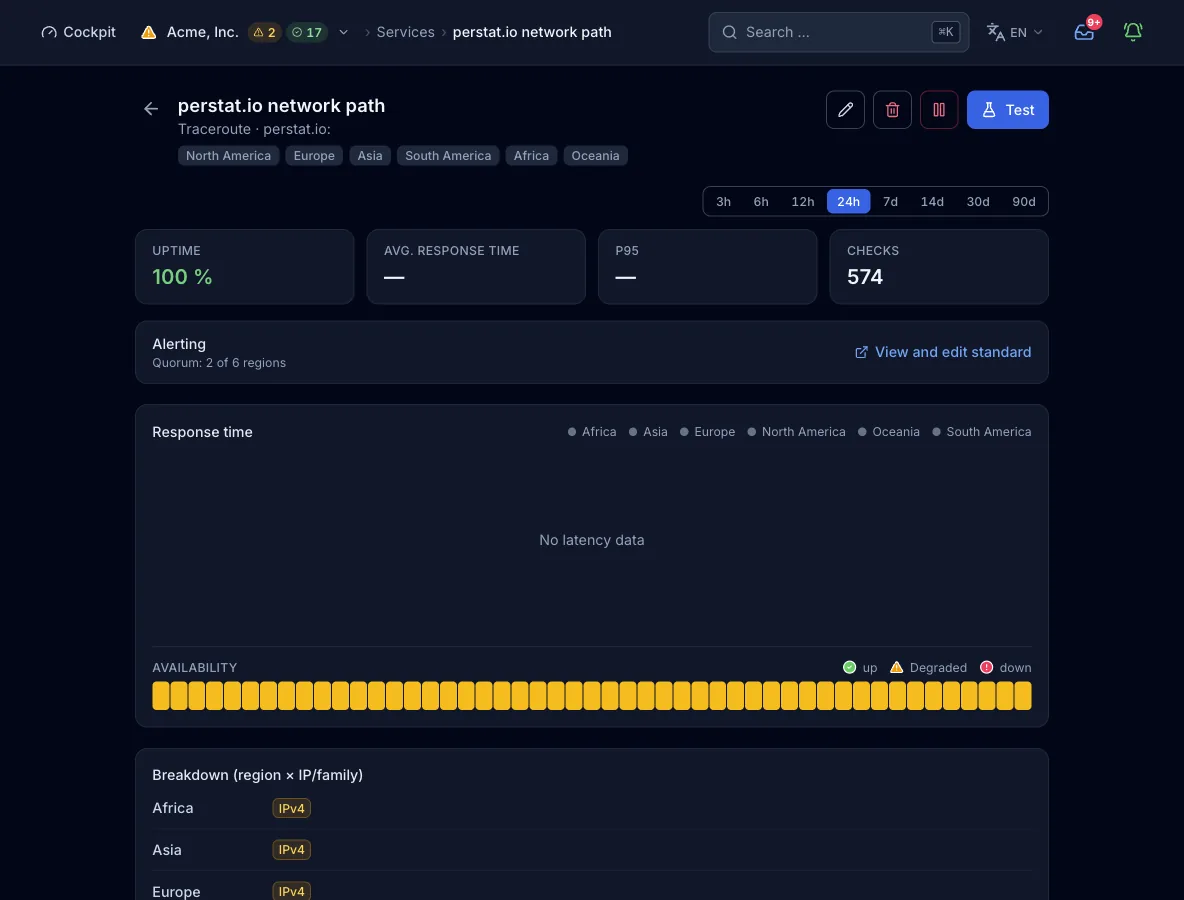
- Every result carries the region that measured it and one sub-result per IP family. There is no per-address and no per-hop sub-result, and the full hop list is not stored.
- Response time and status code
- The type records neither, so the response time chart in the monitor view stays empty.
States and severity
- okThe last hop answered: the target was reached within
max_hops. - degradedThe last line carries a
*, so the target was not reached, or the run returned no hop lines. At the default severity, one IP family that fails to resolve while the other traces makes the check degraded too. - downThe host does not resolve or resolves to a blocked address. With both families and
family_fail_severityset tofailed, one family that fails to resolve makes the check down too. The path itself never produces this state. - errorThe node cannot run the check, because the traceroute binary is missing or the run exceeded its 20 s cap. It counts as an outage with severity critical.
Confirmed by quorum: by default, 2 regions must report the failure before an incident opens. The organization default asks for 2 regions and 2 consecutive checks. A monitor can carry its own rule (count or percent, consecutive checks, minimum duration). Only down and error enter the incident evaluation, so an unreached path stays degraded and never opens an incident by itself.
Plans and limits
- Shortest interval
- 300 s on Free, 60 s on Pulse, and 30 s on Sentinel. Command allows 15 s and Enterprise 10 s, both set only over MCP. The form offers presets from 30 s to 1 h.
- Regions
- 2 of 6 on Free, 3 of 6 on Pulse, and all 6 from Sentinel.
- Monitors
- 10 on Free, 50 on Pulse, 150 on Sentinel, and 500 on Command. Enterprise quotas are custom. The quota counts across the eleven probe types, and agent and heartbeat monitors have their own quotas.
From the pipeline or an agent
The same config works in the deploy step, in an MCP client such as Claude Code, and in the form above. create_monitor needs an organization-wide API key. If you omit regions, the plan picks its default.
{
  "name": "Gateway path",
  "type": "traceroute",
  "interval_seconds": 900,
  "config": {
    "host": "gateway.example.com",
    "max_hops": 30,
    "address_families": ["ipv4", "ipv6"],
    "family_fail_severity": "degraded"
  }
}
Every interface, with its boundary
Limits
- The check is diagnostic, not an availability signal, so an unreached target is degraded and opens no incident. The run itself causes an outage only when traceroute cannot start or exceeds the 20 s cap. Pair it with the ping or HTTP(S) check.
- Each hop gets one probe with a 2 s wait, and the default is 20 hops. The whole run is capped at 20 s.
max_hopsis set over the API or MCP, not in the form.- The check traces one address per family, with no per-address and no per-hop sub-results. Beyond the hop count and the last line, the hop list is not stored.
- The check records no response time and no status code.
- Targets on private, loopback, link-local, and cloud metadata addresses are refused.
- Not every region probes IPv6, so selecting
ipv6restricts the usable regions.