Monitoring and diagnosis
Regional probes, host agents, and heartbeats show whether the problem is the service, DNS, the network, or the host.
See uptime monitoringFive parts of Perstat share one availability record, from monitoring to the interfaces and apps around it. You can read how each one works without an account.
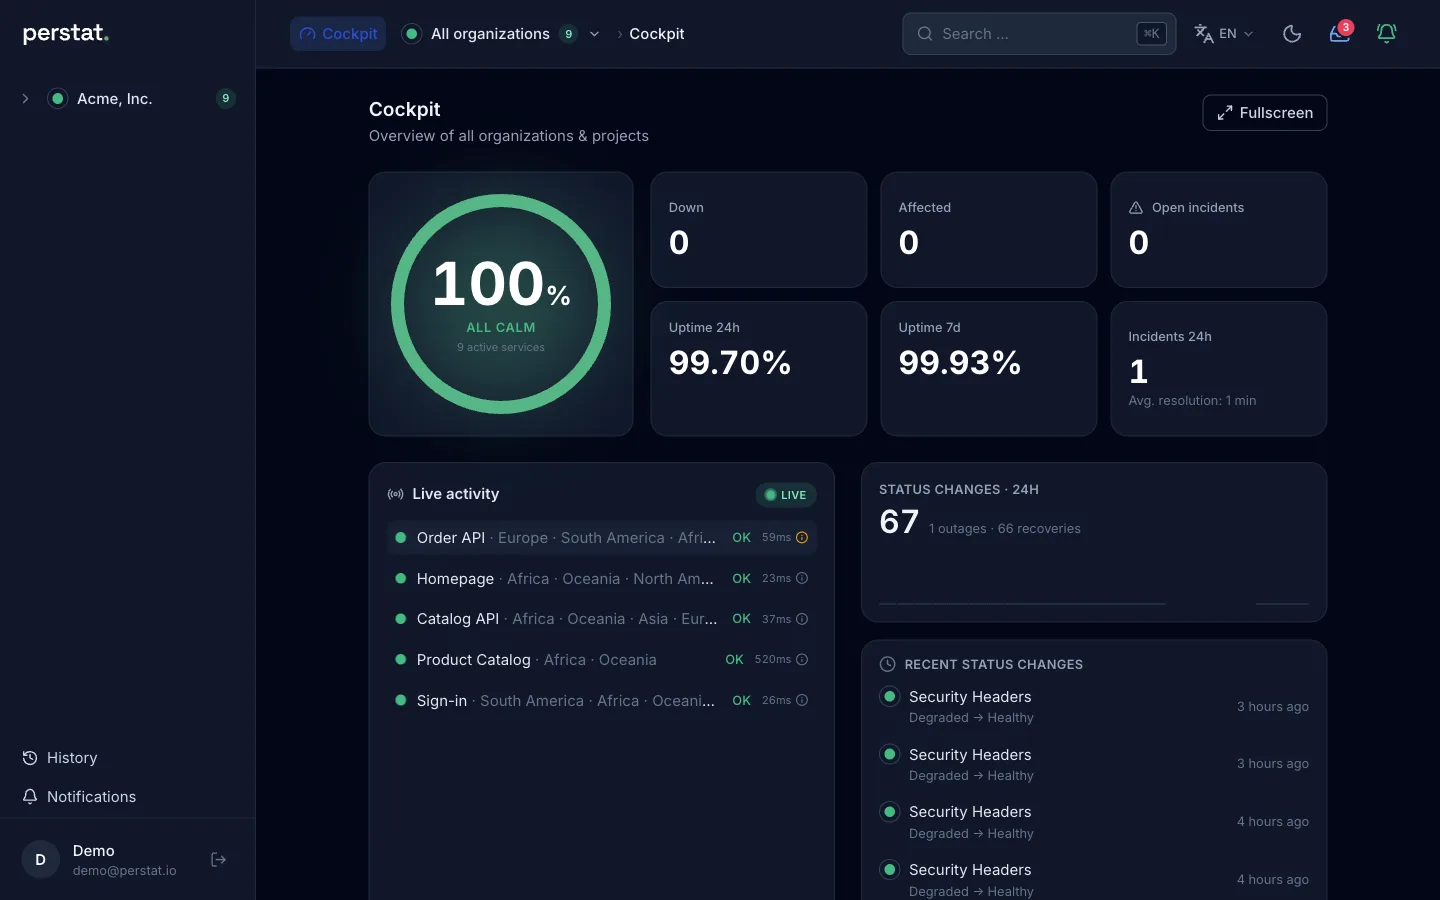
The cockpit, timeline, status communication, and later review all refer to the same event. Perstat does not copy a check result into a separate incident story.
Every view works from the same event instead of handing an outage between disconnected tools.
Thirteen check types observe services, hosts, and jobs.
Eleven regional check types can require agreement across regions before an incident opens.
Acknowledgment makes ownership visible. On-call escalation starts with Sentinel.
Status pages publish the incident explicitly to the audiences you select.
The availability record keeps measured events, curation, and actions together.
Regional probes, host agents, and heartbeats show whether the problem is the service, DNS, the network, or the host.
See uptime monitoringMove from a confirmed incident to visible ownership, personal SMS, or on-call escalation.
See incidents and on-callPublic or password-protected pages, fed by the same incidents.
See status pagesReview measured history, curated outages, and attributed configuration activity.
See evidenceConnect the record to your workflow through connectors, signed webhooks, REST, MCP, or native Apple apps.
See MCP and integrationsEach public sample states what it can and cannot show.
All five prices and the plan boundaries are public, and standard plans are self-service. Security and documentation stay readable without an account.