On this page
One path for services, networks, hosts, and jobs
Every plan includes 13 check types: HTTP, HTTP headers, TCP, DNS, DNS hygiene, domain, TLS certificate, SMTP, IMAP, ping, traceroute, agent, and heartbeat. They cover externally reachable services, host signals, and jobs that report their own outcome. Each result follows one monitor and one incident path instead of being split across separate tools.
Perstat is deliberately bounded to uptime and the record that follows. It is not APM and does not manage logs.
From one result to a confirmed incident
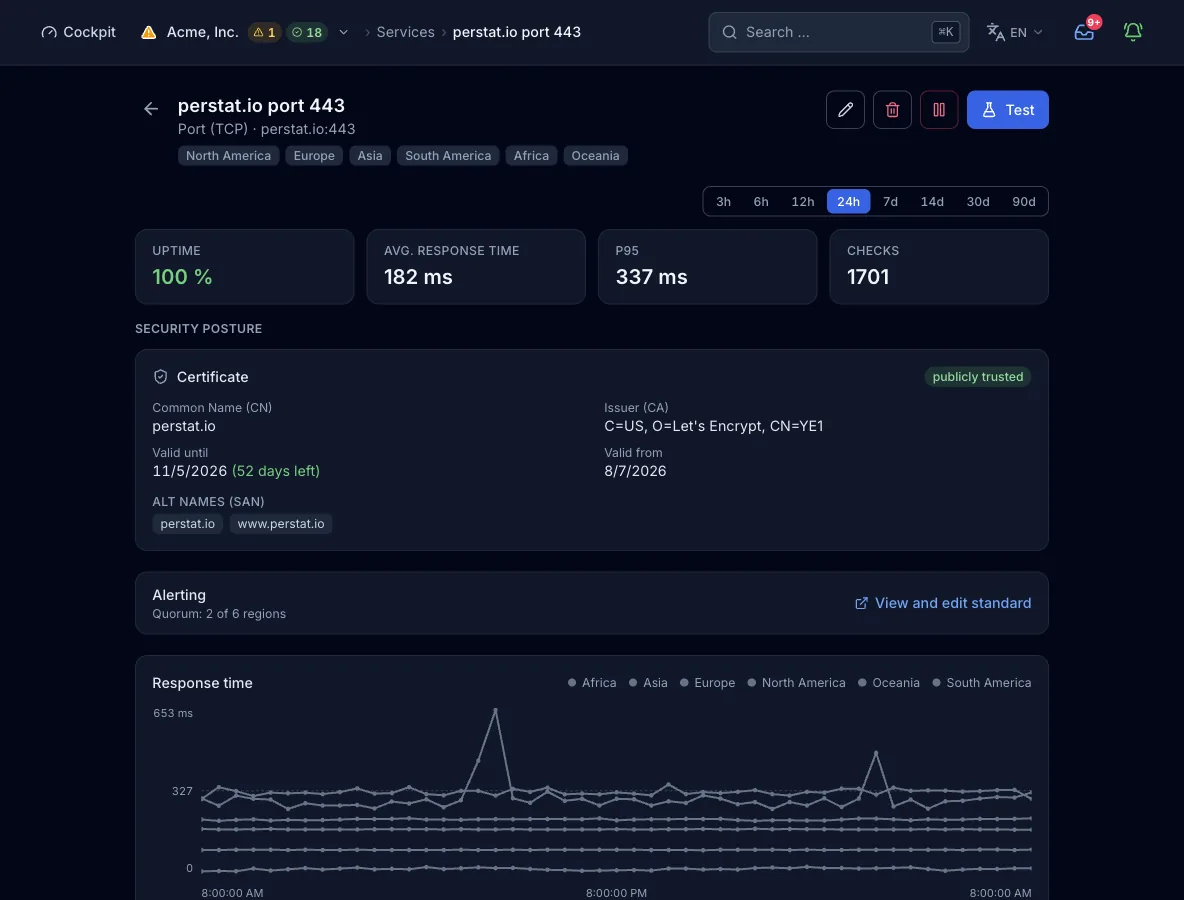
Eleven check types run through regional probes. Under the standard policy, one region alone does not open an incident. The monitor needs a quorum of 2 regions, and that rule is configurable.
Agent and heartbeat are the two exceptions. They report directly and use neither probe regions nor regional quorum.
The quorum documentation spells out both paths. The network page documents the current topology and the regional fold.
See the signal before it becomes a page
Perstat shows a forming state before the configured policy confirms a regional outage. The watchlist keeps regional, IP-family, individual-IP, and node divergences. That gives the operator an early signal without treating the first deviation as an incident.
Confirmed results also keep diagnostic context. Where applicable, Perstat separates DNS time and attributes a failure to one of these layers:
- target application
- target DNS
- network
- Perstat resolver
- probe node
HTTP, network, and DNS stay inspectable
An HTTP monitor can assert an expected status, keyword, or regular expression. The same monitor can carry TLS, security-header, and DNS-hygiene subchecks. Perstat follows redirects for up to 5 hops and checks every destination in the chain against the same SSRF blocklist.
Checks over A and AAAA records keep results by address family and IP. A DNS monitor can compare its answer set with another monitor by identical, subset, or overlap matching.
Hosts and jobs report directly
The native host agent supports Linux on x86_64 and aarch64, and macOS as a universal binary. It reports availability and named services, along with CPU, memory, and disk.
The agent reads no command lines, environment variables, or usernames. It has no remote-command channel. Windows is not supported today.
A heartbeat gives a job two endpoints: healthy and failure. Silence beyond the configured period plus grace marks the heartbeat down. The failure endpoint marks an explicit failed run without waiting for that silence window.
Maintenance suppresses alarms and stays in the history
A scheduled maintenance window suppresses new incidents, remains in the availability record, and is excluded from uptime. A discarded false positive creates a separate, reversible exclusion window with a reason and an actor. The availability record explains that review path.
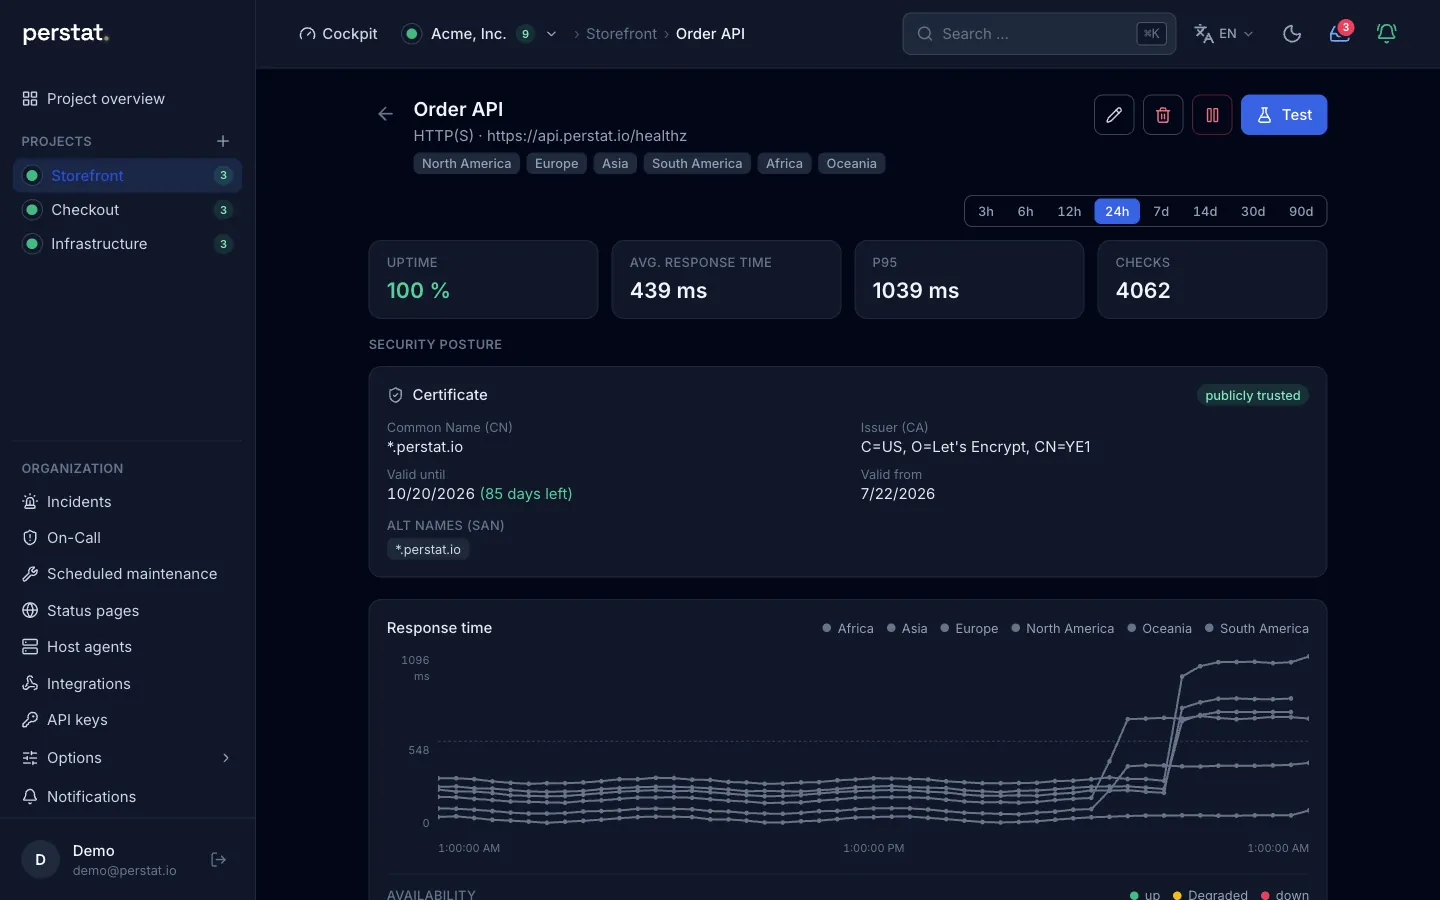
Inspect a real monitor
Plans set probe regions and the shortest interval
| Plan | Probe regions | Shortest interval (seconds) |
|---|---|---|
| Free | 2 | 300 |
| Pulse | 3 | 60 |
| Sentinel | 6 | 30 |
| Command | 6 | 15 |
| Enterprise | 6 | 10 |
The web form offers 30 seconds and longer. On Command and Enterprise, you set 15 or 10 seconds through MCP.
The probe regions are:
- North America
- South America
- Europe
- Africa
- Asia
- Oceania
Exact monitor, agent, heartbeat, and retention limits are on the pricing page.
Start monitoring free, or configure the first monitor with the monitor documentation.